Why Is Chainbase (C) Price Pumping? This Hidden Risk Could Catch Late Buyers Off Guard
March 27, 2026
Chainbase Price(C)
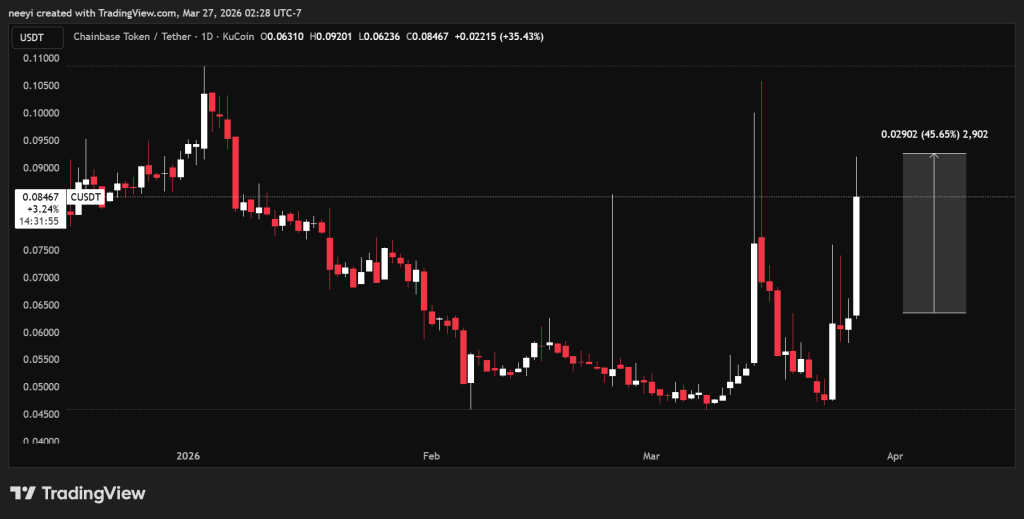
The live Chainbase (C) price today is $ 0.07129, with a 1.23% change over the past 24 hours. The current C to USD conversion rate is $ 0.07129 per C.
Chainbase currently ranks #- by market capitalization at --, with a circulating supply of -- C. During the last 24 hours, C traded between $ 0.07013 (low) and $ 0.07426 (high), reflecting market activity. Its all-time high stands at --, while the all-time low was --.
In short-term performance, C moved +0.56% in the last hour and -11.39% over the past 7 days. Over the past day, total trading volume reached $ 64.14K.
------
$ 64.14K$ 64.14K$ 64.14K
$ 71.29M$ 71.29M$ 71.29M
------
1,000,000,000 1,000,000,000 1,000,000,000
BASE
The current Market Cap of Chainbase is --, with a 24-hour trading volume of $ 64.14K. The circulating supply of C is --, with a total supply of 1000000000. Its Fully Diluted Valuation (FDV) is $ 71.29M.
$ 0.07013$ 0.07013$ 0.07013
$ 0.07426$ 0.07426$ 0.07426
------
------
+0.56%
+1.23%
-11.39%
-11.39%
Track the price changes of Chainbase for today, 30 days, 60 days, and 90 days:
| Period | Change (USD) | Change (%) |
|---|---|---|
| Today | $ +0.0008663 | +1.23% |
| 30 Days | $ -0.01437 | -16.78% |
| 60 Days | $ -0.00667 | -8.56% |
| 90 Days | $ -0.01252 | -14.94% |
Today, C recorded a change of $ +0.0008663 (+1.23%), reflecting its latest market activity.
Over the past 30 days, the price shifted by $ -0.01437 (-16.78%), showing the token's short-term performance.
Expanding the view to 60 days, C saw a change of $ -0.00667 (-8.56%), giving a broader perspective on its performance.
Looking at the 90-day trend, the price moved by $ -0.01252 (-14.94%), offering insight into the token's long-term trajectory.
Want to unlock the all-time price history and price movements of Chainbase (C)?
Check out the Chainbase Price History page now.
This analysis leverages AI models to evaluate Chainbase recent price action, volume dynamics, and market sentiment. Real-time data processing highlights emerging trends and potential trading setups, supporting more informed and timely decisions.
Current overall sentiment in the C market: bullish, bullish 72% | bearish 28%;
| Indicator Dimension | Model Conclusion | Proportion/Threshold | Quick Take |
|---|---|---|---|
| KDJ | Golden Cross | K > D | Short-term momentum warming up, temperature rising. |
| EMA Group | 5‑6 Buy | 60‑80% Buy | Majority of MAs pointing up, bullish alignment dominant. |
| StochRSI | > 80 | Overbought Zone | Short-term rising too fast, watch for pullback risk. |
| MACD | Golden Cross | DIF > DEA | Bullish momentum emerging. |
| BOLL (20,2) | Lower ≤ Price ≤ Middle | Between lower and middle band | Relatively weak, but not extreme. |
| RSI (14) | Neutral | 30‑70 | Within normal range, still has room. |
| MA Group | 5‑6 Buy | 60‑80% Buy | Majority of MAs pointing up, bullish alignment dominant. |
| Pivot Point | Pivot ≤ Price ≤ R1 | Between Pivot‑R1 | Just left central pivot, moderately high position. |
**Market Structure** C_USDT is currently trading at 0.0764 on the 4-hour timeframe, operating above the central pivot level of 0.07565, which corresponds to a 0.99% premium. The price is situated in the upper-middle region of the pivotal structure. Both the Simple Moving Average (MA) and Exponential Moving Average (EMA) across all timeframes indicate a bullish configuration, with the price positioned near the upper boundary of the moving average cluster. The structural hierarchy is currently within the testing range of R1 (0.07672), approximately 1.44% away from the upper boundary of R2 (0.07751). **Momentum Status** The MACD indicator has generated a golden cross signal, indicating that short-term momentum aligns with the overall trend set by the moving average system. The RSI remains within a neutral range, while the fast and slow stochastic indicators show a layered pattern. Volatility metrics do not provide clear directional signals, suggesting that momentum is predominantly driven by the moving average framework. **Key Price Levels** On the upside, R1 is located at 0.07672, approximately 0.94% above the current price, while R2 sits at 0.07751, about 1.44% above the current price, forming the immediate upper price boundary. On the downside, the central pivot level of 0.07565 serves as a nearby reference point, roughly -0.99% below the current price. Additionally, S1 is positioned at 0.07486, approximately -2.02% below the current price.
This content is generated by AI based on historical and current market data. It is for informational purposes only and does not constitute any investment advice.
In 2040, the price of Chainbase could potentially see a growth of 0.00%. It could reach a trading price of $ --.
C (C) is a digital asset that operates on a decentralized network, utilizing blockchain technology to facilitate peer-to-peer transactions. It is designed to serve as a medium of exchange, where users can make transactions directly without the need for an intermediary, such as a bank or payment gateway. The asset's consensus mechanism is based on proof-of-work, which requires miners to solve complex mathematical problems to validate transactions and add them to the blockchain. C's issuance model is capped, meaning there is a finite supply of the asset that can ever be created. This design is intended to mimic the scarcity of precious metals and to prevent inflation. The asset is typically used for online purchases, remittances, and as a store of value.
Ready to get started with Chainbase? Buying C is quick and beginner-friendly on MEXC. You can start trading instantly once you have made your first purchase. To learn more, check out our full guide on how to buy Chainbase. Below is a quick 5-step overview to help you begin your Chainbase (C) Buying journey.
: Step-by-Step Guide via MEXC Website, Card & Account")
Owning Chainbase allows you to open more doors in terms of just buying and holding. You can trade BTC across hundreds of markets, earn passive rewards through flexible staking and savings products, or leverage professional trading tools to grow your assets. Whether you are a beginner or professional, experienced investor, MEXC makes it easy to maximize your crypto potential. Below are the top four ways you can make the most of your Bitcoin tokens
Trade with up to 500x leverage and deep liquidity.
Buying Chainbase (C) on MEXC means more value for your money. As one of the lowest-fee crypto platforms on the market, MEXC helps you reduce costs from your very first trade.
Check out MEXC's competitive trading fees
Furthermore, you can trade selected spot tokens with absolutely no fees via MEXC's Zero Fee Fest.
Chainbase is building the Hyperdata Network for AI — a foundational layer for the DataFi era. We transform fragmented onchain signals into structured, verifiable, and AI-ready data, enabling permissionless coordination between agents, apps, and humans. With over 500 billion+ data calls, a vibrant community of 20,000+ developers, and 8,000+ project integrations, Chainbase powers a decentralized data economy where data becomes capital: composable, monetizable, and open to all.
For a more in-depth understanding of Chainbase, consider exploring additional resources such as the whitepaper, official website, and other publications:
| Time (UTC+8) | Type | Information |
|---|---|---|
| 02-11 14:20:00 | Industry Updates | Over the past 24 hours, CEX net outflow of 59,400 ETH |
| 02-10 18:39:21 | On-chain Data | Yesterday, Bitcoin spot ETF saw a net inflow of $144.9 million, while Ethereum ETF recorded a net inflow of $57 million |
| 02-04 11:04:00 | Industry Updates | Crypto Fear Index Drops to 14 Again, Market Remains in "Extreme Fear" Zone |
| 02-04 00:48:00 | Industry Updates | $285 Million Liquidated Across the Network in the Past 24 Hours, Both Longs and Shorts Wiped Out |
| 02-01 01:12:00 | Industry Updates | Bitcoin breaks below previous low of $80,600, hitting a new low since April 11, 2025 |
| 01-28 07:44:00 | Industry Updates | Dollar Index Hits Lowest Level Since February 2022, Crypto Market Continues Rally |


Explore spot and futures markets, view live Chainbase price, volume, and trade directly.
Top cryptocurrencies with market data available on MEXC
Currently trending cryptocurrencies that are gaining significant market attention
Recently listed cryptocurrencies that are available for trading
Cryptocurrency prices are subject to high market risks and price volatility. You should invest in projects and products that you are familiar with and where you understand the risks involved. You should carefully consider your investment experience, financial situation, investment objectives and risk tolerance and consult an independent financial adviser prior to making any investment. This material should not be construed as financial advice. Past performance is not a reliable indicator of future performance. The value of your investment can go down as well as up, and you may not get back the amount you invested. You are solely responsible for your investment decisions. MEXC is not responsible for any losses you may incur. For more information, please refer to our Terms of Use and Risk Warning. Please also note that data relating to the above-mentioned cryptocurrency presented here (such as its current live price) are based on third party sources. They are presented to you on an “as is'' basis and for informational purposes only, without representation or warranty of any kind. Links provided to third-party sites are also not under MEXC’s control. MEXC is not responsible for the reliability and accuracy of such third-party sites and their contents.