

Liquidation
Share
Liquidation occurs when a trader’s collateral is no longer sufficient to cover their leveraged position’s losses, triggering an automated forced closure by the exchange's liquidation engine. It is a critical risk-management mechanism that ensures the solvency of lending protocols and derivative platforms. In 2026, the focus has moved toward MEV-resistant liquidation models that protect users from predatory "cascades." This tag provides essential information on maintenance margins, health factors, and how to avoid liquidation in high-volatility environments.
15111 Articles
Created: 2026/02/02 18:52
Updated: 2026/02/02 18:52
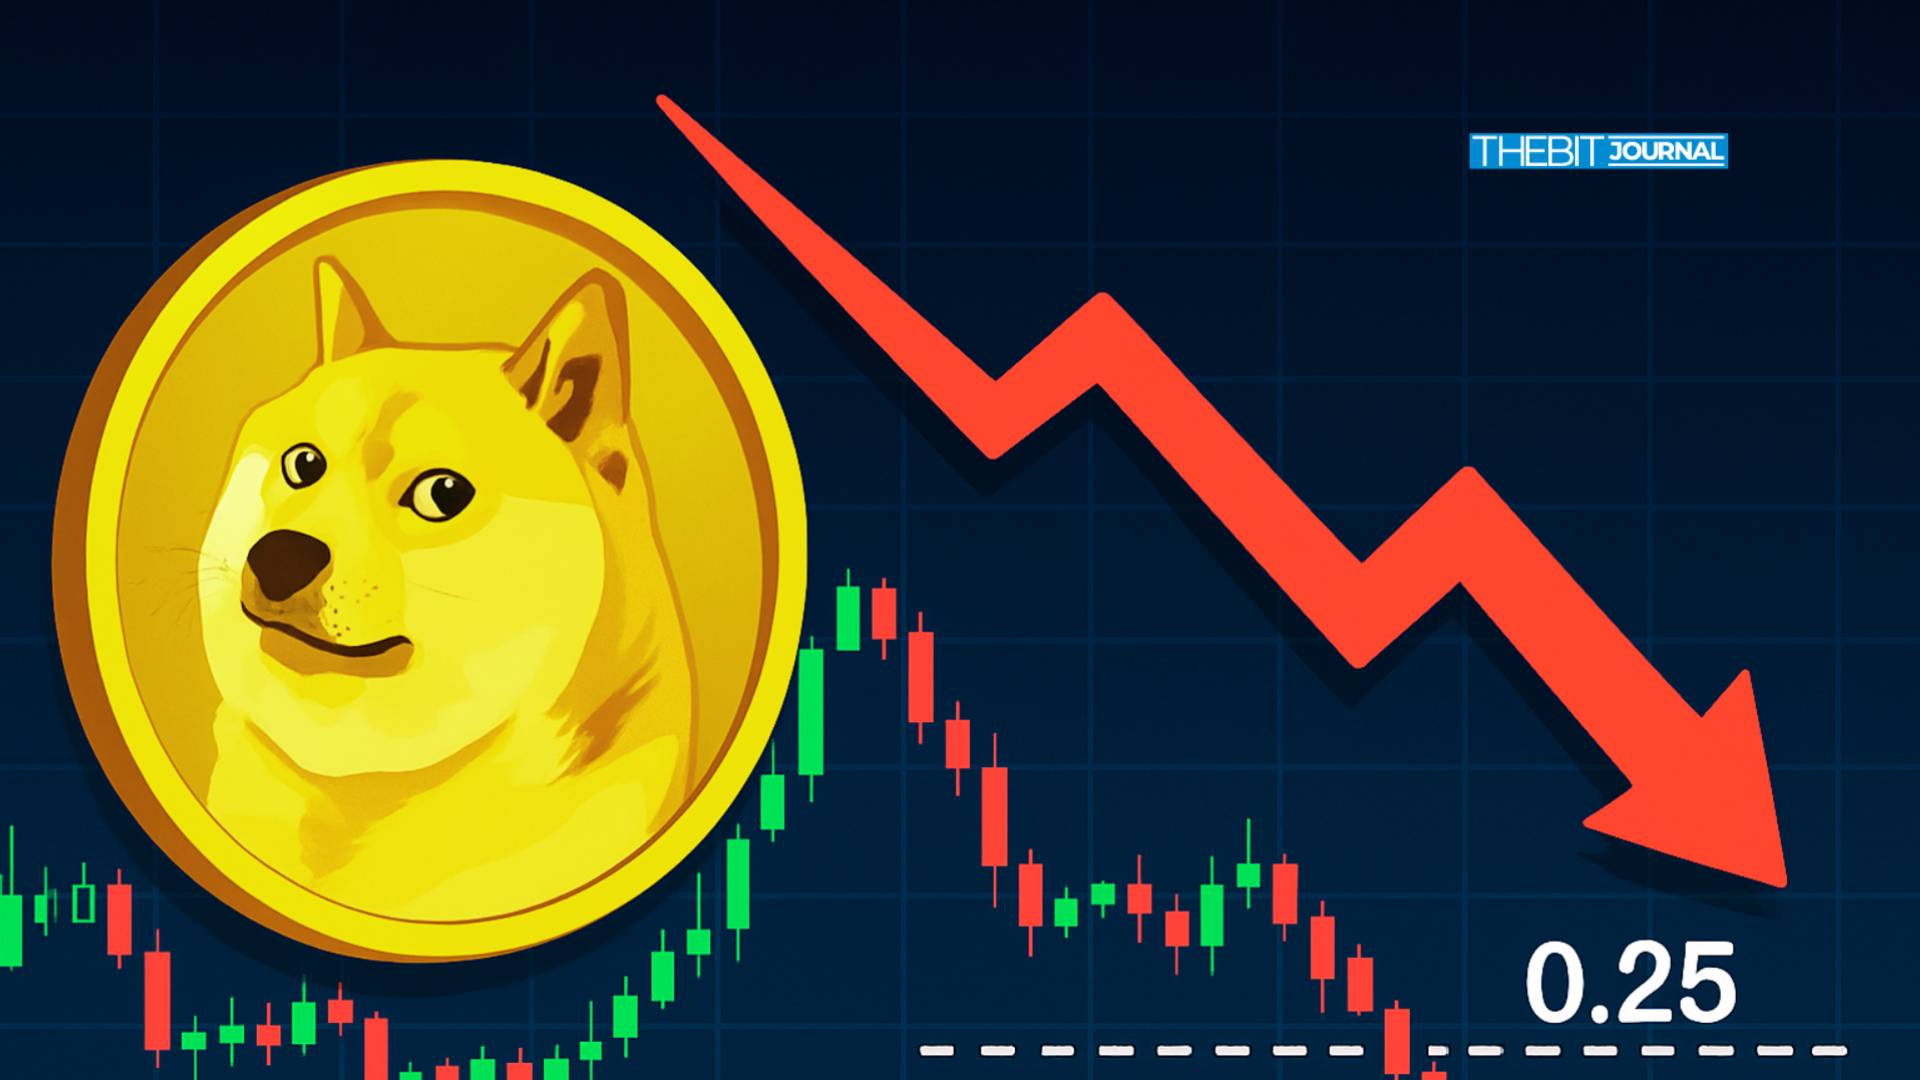


How Low Could It Fall This Week?
Author: BitcoinEthereumNews
2025/10/08
Share


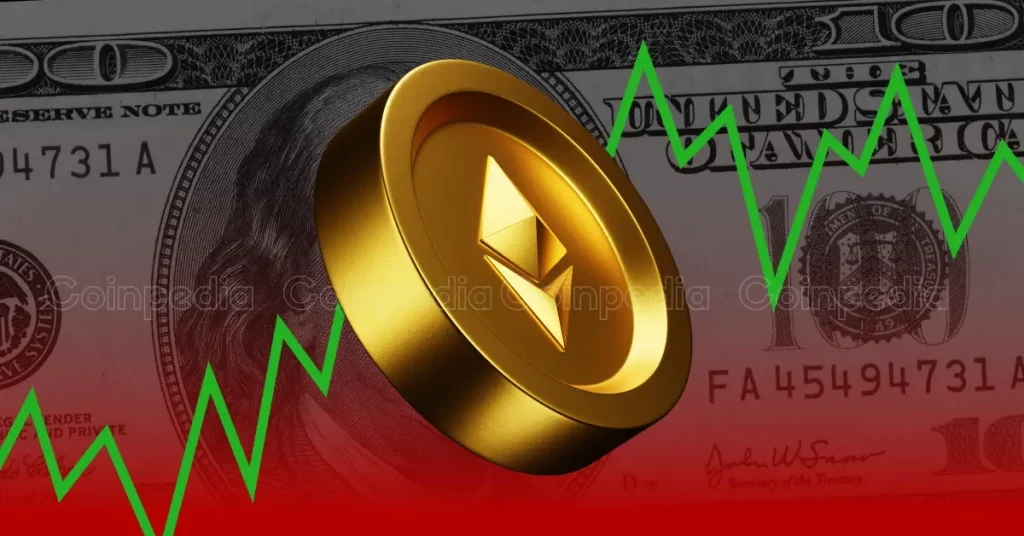
Why Is Ethereum (ETH) Price Falling Today?
Author: CoinPedia
2025/10/08
Share

Recommended by active authors

Latest Articles

Pi Network Community and the Long Road to Mainnet: Why the Journey Matters More Than the Launch
2026/02/07 12:47

Why Traditional Banks Need Mobile Money Solutions to Survive the Next 5 Years
2026/02/07 12:37

Pi Network Tech Upgrade Unlocks Mainnet Migration for 2.5 Million Users and Introduces Palm Print Security
2026/02/07 12:28

What is a Privacy Coin? [year Cryptocurrency Guide
2026/02/07 12:20

Severe Crypto Restrictions in China Shake Global Markets
2026/02/07 12:00