

How to Quickly Draw Price Lines and High/Low Price Lines
1. What is the Price Line and High–Low Price Line?
1.1 What is the Price Line?
1.2 What is the High–Low Price Line?
2. How to Read the Price Line and the High–Low Price Line?
3. Three Key Benefits of the Price Line and High–Low Price Line
4. How to Quickly Draw Price Lines and High–Low Price Lines on MEXC
5. Mastering Basic Analysis Tools to Improve Trading Performance
Recommended Reading:
- Why Choose MEXC Futures? Gain deeper insight into the advantages and unique features of MEXC Futures to help you stay ahead in the market.
- MEXC Futures Trading Tutorial (App) Understand the full process of trading Futures on the app and get started with ease.
Popular Articles
View More
Will HOOD Stock Hit $191 by 2030? Robinhood Stock Price Prediction and Analyst Targets
Robinhood (NASDAQ: HOOD) spent most of 2025 doing something it had never managed before: convincing Wall Street to take it seriously. The stock climbed from an all-time low of $6.81 in 2022, and from

How to Read US Stock Pre-Market and After-Hours Unusual Movements: Distinguishing Real Signals from Short-Term Noise
Pre-market and after-hours trading sessions allow investors to buy and sell stocks outside the regular 9:30 AM to 4:00 PM ET exchange window. Price moves during these sessions carry real information,
How to Read U.S. Stock Market Signals: Price Action, Volume, Breakouts, and Sector Rotation
For most traders, looking at a stock chart for the first time feels like trying to read a foreign language. A stock is up 4% in the pre-market—is that a buy signal, or a trap? A chart breaks past a

Hot Crypto Updates
View More
Talks Collapse! US-Iran Switzerland Meeting Canceled — Bitcoin Drops 2%
Overview Just 24 hours after global markets cheered a landmark US-Iran memorandum of understanding, the celebration is over. On June 19, 2026, Switzerland's Foreign Ministry officially confirmed that

Can BEEG Hit 10 Cents? A Data-Driven Analysis of Beeg Blue Whale's Real Price Potential
Can BEEG reach $0.10? This in-depth analysis covers Beeg Blue Whale's current price, tokenomics, price prediction scenarios, and why MEXC is the top platform to trade BEEG — with the lowest fees and

XRPL 3.2.0 Is Live: The End of rippled, and What XRP Holders Actually Need to Do
XRP Ledger's v3.2.0 mainnet upgrade activated on June 15, 2026, renaming the core server software from rippled to xrpld and cutting node memory usage by up to 40%. Here's what it means for XRP

Trending News
View More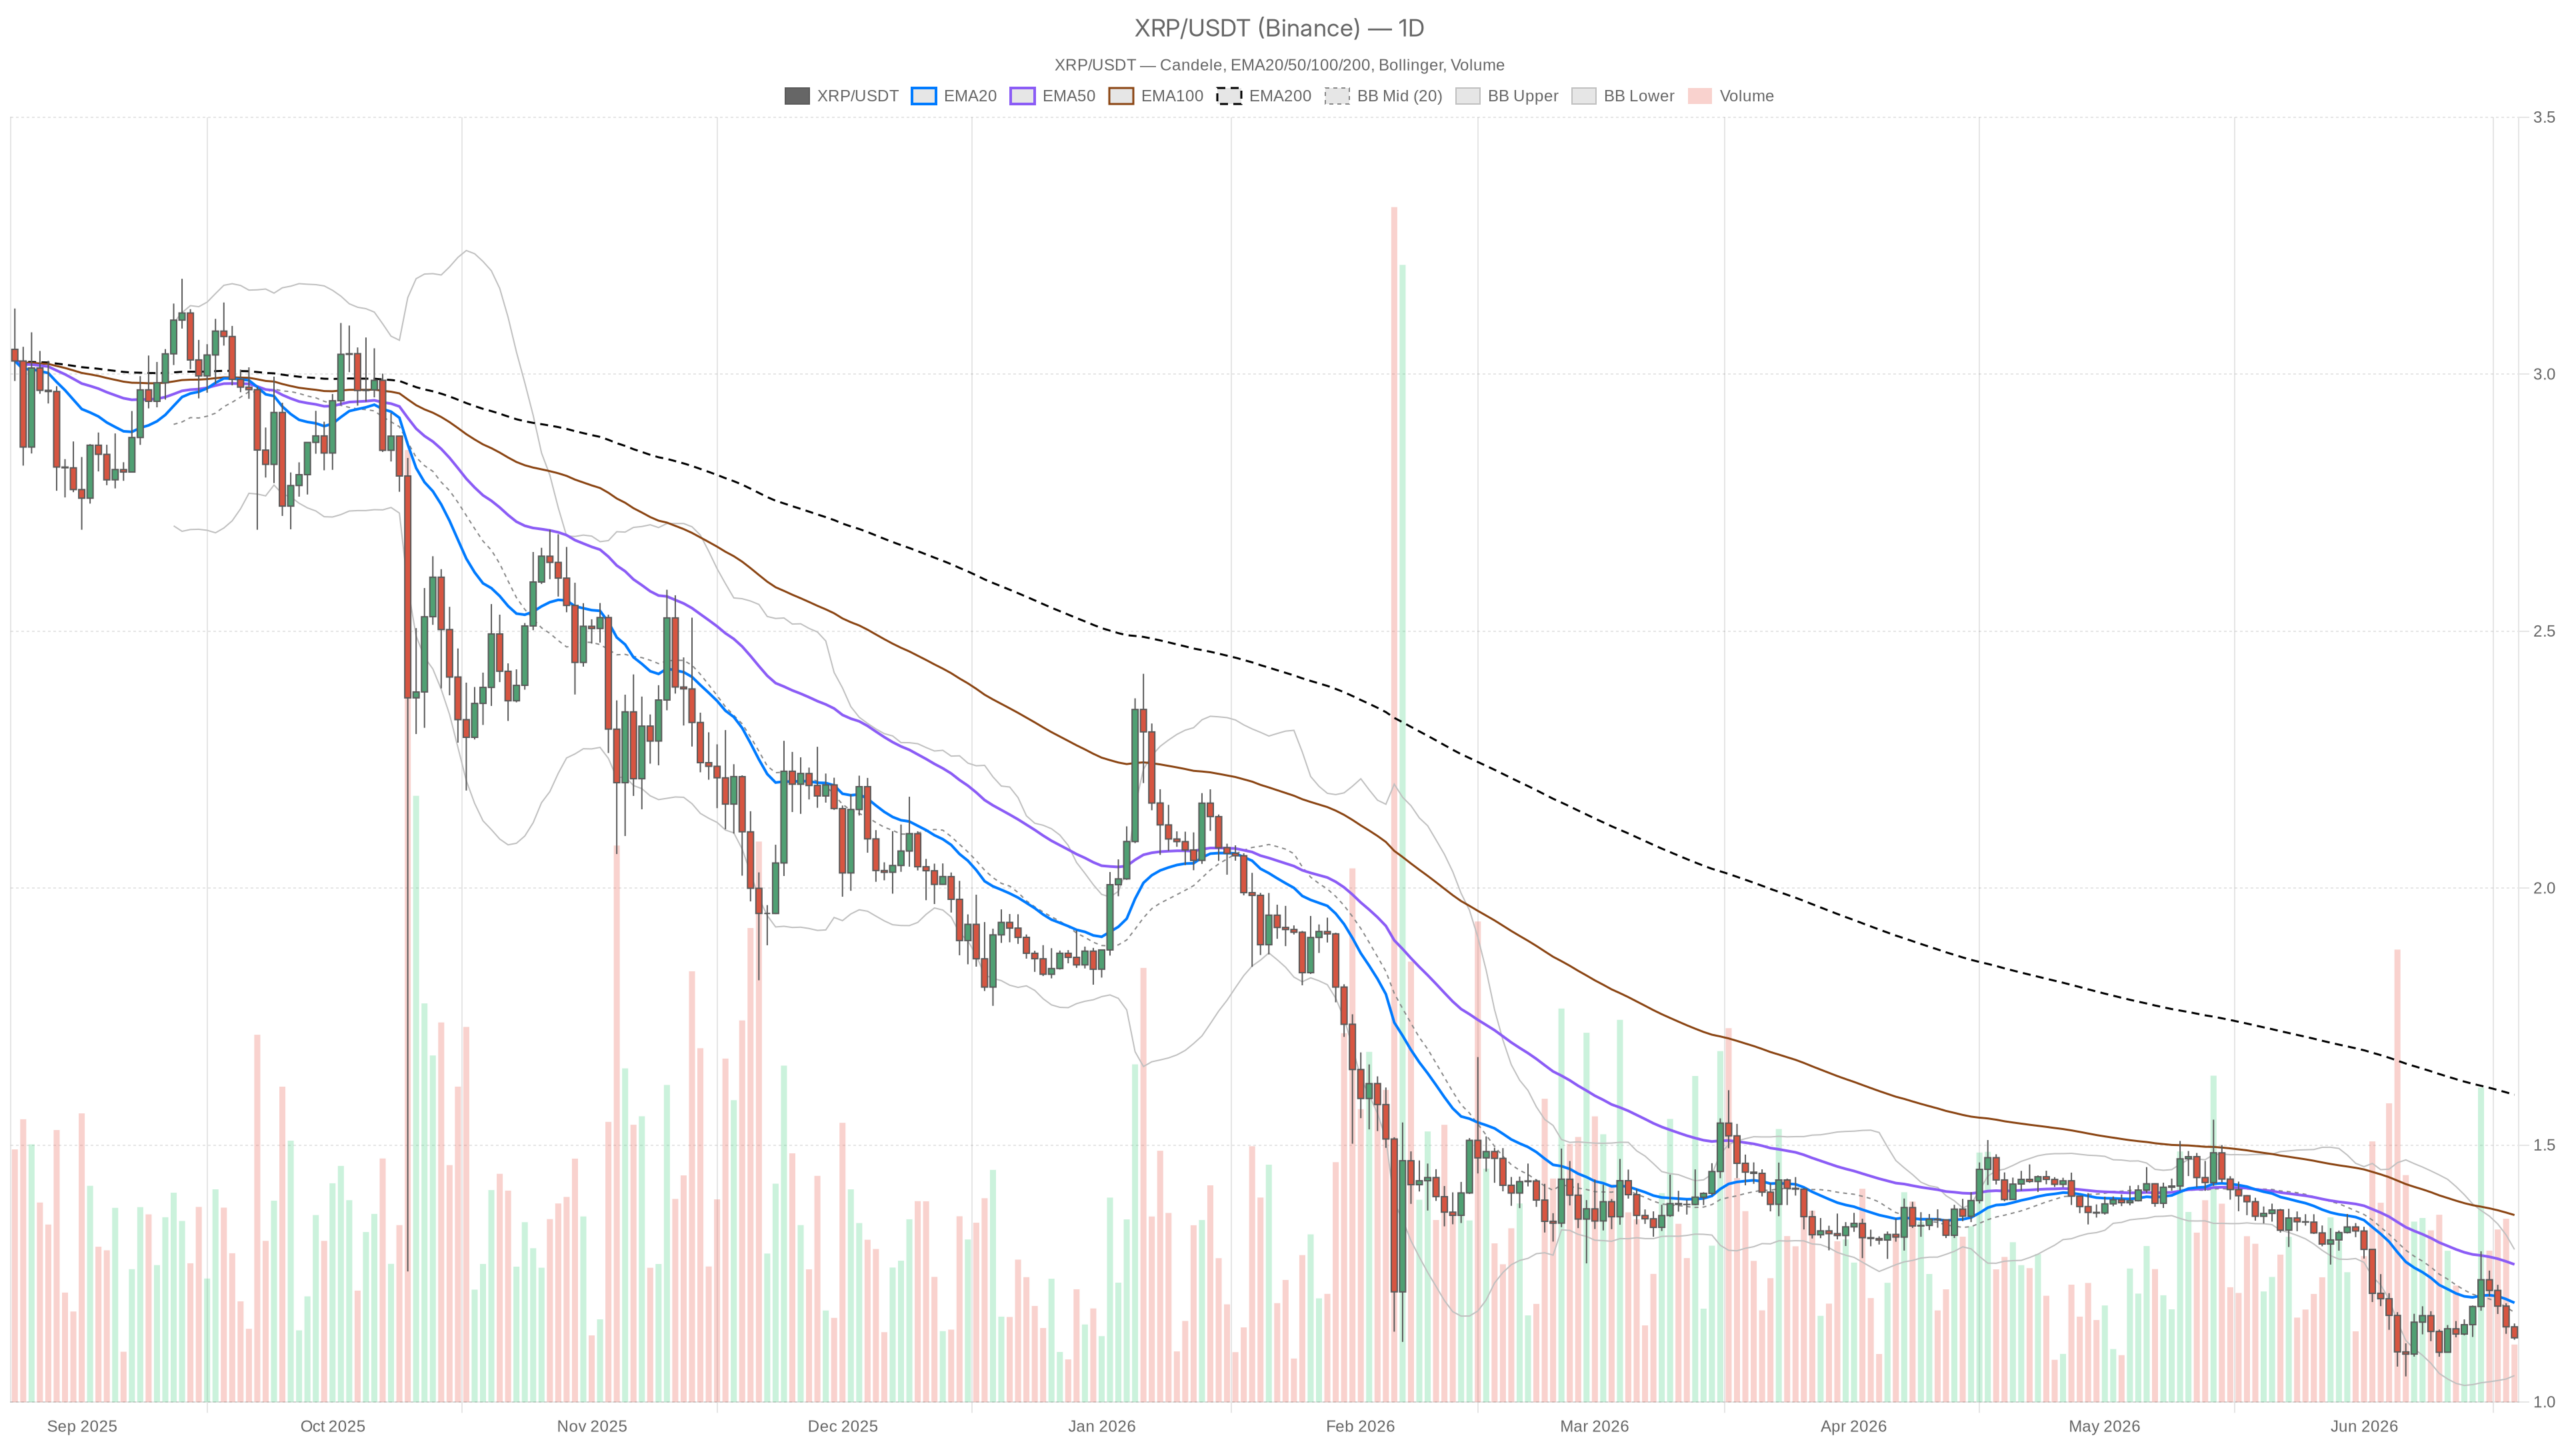
Ripple Price Below All Major EMAs — Can Bears Push to $1.05?
As of June 19, 2026, the broader crypto market is bleeding roughly 2.4% in 24 hours while Bitcoin dominance sits above 55.9%. The Ripple price reflects this bearish
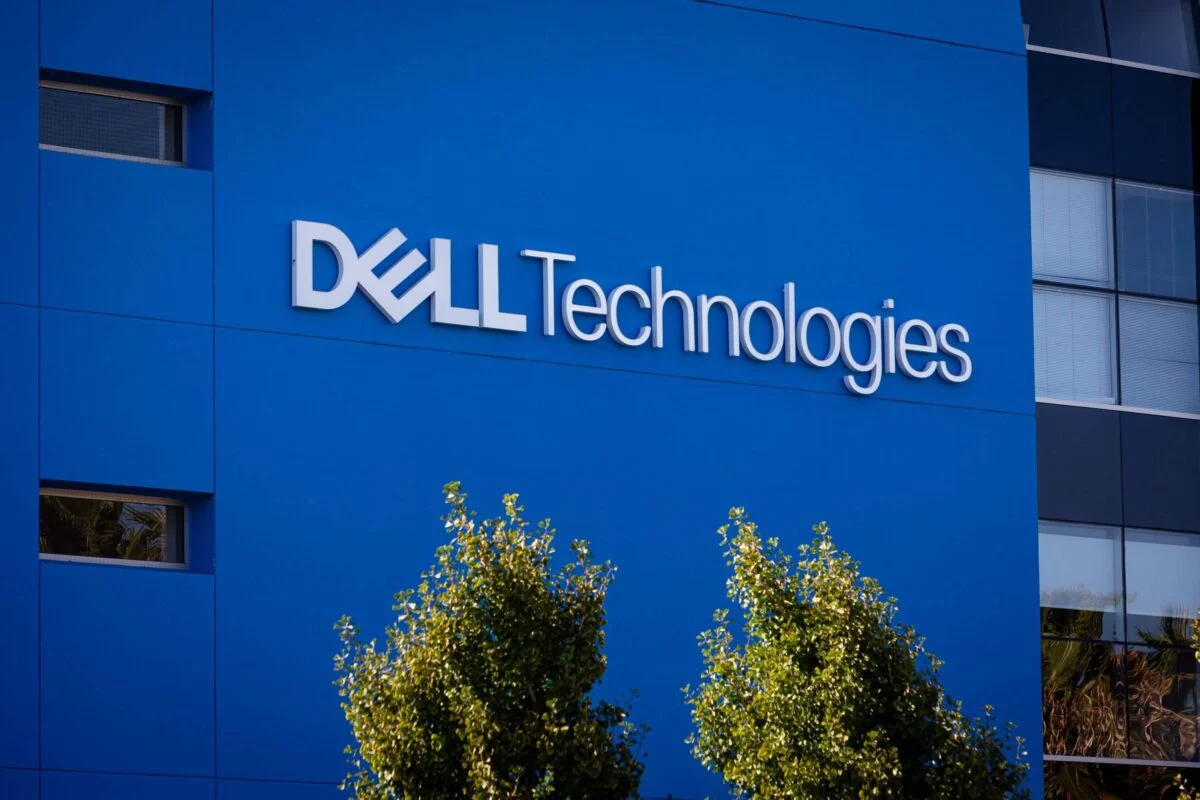
Dell (DELL) Stock Rockets 250% as AI Infrastructure Demand Drives 757% Server Revenue Surge
Dell (DELL) stock surged 250% in 12 months after Q1 AI server revenue jumped 757% to $16.1B. EPS of $4.86 crushed estimates. Analysts see more upside ahead. The


Related Articles
View More
What Is MEXC Earn?
1. What is MEXC Earn?MEXC Earn is a one-stop product launched by MEXC to help users discover a variety of token-holding earning opportunities. It covers flexible savings, fixed savings, and on-chain e

How to Deposit Crypto to MEXC App: MetaMask & Wallet Transfer Guide
If you have crypto in other wallets or platforms, you can choose to transfer them to the MEXC platform for trading.How to Deposit Crypto to the MEXC PlatformStep 1: Open the MEXC App on your mobile ph

How to Deposit Crypto to the MEXC Platform (Website)
If you have crypto in other wallets or platforms, you can choose to transfer them to the MEXC platform for trading.How to Deposit Crypto to the MEXC PlatformStep 1: Open your browser and log in to the


