

What is Parabolic SAR?
1. Core Principles of the Parabolic SAR Indicator
Trend Identification:
- SAR dots below the price indicate an uptrend, suggesting a favorable environment for long positions.
- SAR dots above the price signal a downtrend, indicating a potential opportunity for short positions.
Stop-Loss and Reversal Signals:
- When SAR dots move closer to the price or are breached, it may suggest an impending trend reversal, prompting traders to reassess and adjust their positions accordingly.
2. Advantages of the Parabolic SAR Indicator
3. Limitations of the Parabolic SAR Indicator
4. How to Use the Parabolic SAR Indicator on MEXC
Popular Articles
View More
Will HOOD Stock Hit $191 by 2030? Robinhood Stock Price Prediction and Analyst Targets
Robinhood (NASDAQ: HOOD) spent most of 2025 doing something it had never managed before: convincing Wall Street to take it seriously. The stock climbed from an all-time low of $6.81 in 2022, and from

How to Read US Stock Pre-Market and After-Hours Unusual Movements: Distinguishing Real Signals from Short-Term Noise
Pre-market and after-hours trading sessions allow investors to buy and sell stocks outside the regular 9:30 AM to 4:00 PM ET exchange window. Price moves during these sessions carry real information,
How to Read U.S. Stock Market Signals: Price Action, Volume, Breakouts, and Sector Rotation
For most traders, looking at a stock chart for the first time feels like trying to read a foreign language. A stock is up 4% in the pre-market—is that a buy signal, or a trap? A chart breaks past a

Hot Crypto Updates
View More
Mbappe vs. Yamal vs. Kane: Who Was Born to Win the 2026 World Cup Golden Ball?
Overview The 2026 FIFA World Cup — the largest in history with 48 teams and 104 matches across three nations — is now underway. Three names dominate every pre-match conversation: Kylian Mbappe, the

Bitcoin Steadies After Weekend Shock — While Hyperliquid Quietly Steals the Spotlight
Overview A weekend diplomatic standoff between the U.S. and Iran sent Bitcoin and Ethereum sharply lower, rattling crypto markets with a fresh bout of geopolitical uncertainty. As macro conditions

SpaceX Secondary Shares Jump 50% as Private Market Demand Surges — Early Sellers Regret Exit Timing
The private market for SpaceX shares has become one of the most remarkable wealth-creation stories in modern investing. Over the past several months, demand for SpaceX stock in secondary markets has

Trending News
View More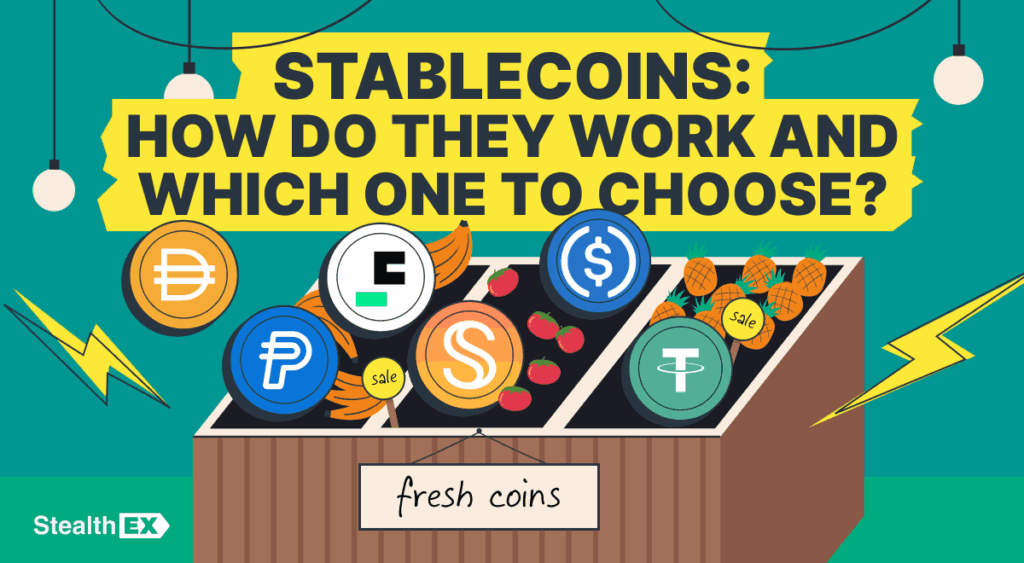
Stablecoins Explained: Which to Choose?
What is a stablecoin and how does it work? Discover the 4 main stablecoin types, compare top assets like USDT, USDC, and USDS, and choose the safest option for

Gold Rebounds From One-Week Low: Can Peace-Talk Optimism Coexist With Hawkish Fed Risk?
Spot gold near $4,332/oz after a U.S.-Iran interim deal cooled oil risks, while a hawkish Fed dot‑plot lifted yields and the dollar. Here’s the macro tug‑of‑war


Related Articles
View More
How to Use TradingView on MEXC
TradingView is a powerful trading analysis tool that caters to users of all experience levels. MEXC has integrated TradingView's charting tools, allowing you to use them directly on the MEXC platform.

Analysis of Common Technical Indicators in the Cryptocurrency Market
In crypto trading, technical indicator analysis refers to a quantitative method that uses mathematical and statistical formulas to assess market trends. By processing price and volume data through spe

What Is the Stochastic Indicator (KDJ)?
The Stochastic Indicator (KDJ) is a technical analysis tool that analyzes price trends to assess market strength and identify overbought and oversold conditions, helping traders make buy and sell deci


