XRP price has spent the past several weeks fighting to hold key support levels. Every attempt to recover has faced resistance, and fresh network data now raisesXRP price has spent the past several weeks fighting to hold key support levels. Every attempt to recover has faced resistance, and fresh network data now raises

XRP Price Headed for Its Biggest Test Since 2024 as Network Activity Crashes

2026/06/19 18:00
Okuma süresi: 5 dk
Bu içerikle ilgili geri bildirim veya endişeleriniz için lütfen crypto.news@mexc.com üzerinden bizimle iletişime geçin.

XRP price has spent the past several weeks fighting to hold key support levels. Every attempt to recover has faced resistance, and fresh network data now raises another concern that could influence the next move.

Recent figures shared by analyst Ali Charts show a sharp decline in XRP network activity. That development arrives at a time when XRP is already struggling to maintain important technical support. Combined with weakening price structure and continued uncertainty across the broader crypto market, the latest data raises a difficult question: how much further can XRP price fall before buyers return in force?

XRP Network Activity Has Fallen Sharply as XRP Price Struggles to Hold Support

Ali Charts pointed out that XRP network activity has dropped by nearly 50% during the past two weeks. Active addresses reportedly declined from about 50,000 to roughly 25,000 over that period.

Network activity often provides insight into how much demand exists for a blockchain. A growing number of active addresses can indicate stronger participation and more transaction activity. A declining figure can point to reduced engagement across the network.

That drop comes at an uncomfortable time for Ripple’s token. XRP price has already been moving lower after failing to sustain several recovery attempts.

Another warning came from analyst That Martini Guy, who has been closely watching the $1.15 level. He explained that this support zone played a major role in preserving the market structure that XRP had maintained for months.

His concern centers on a pattern of weakening rallies. XRP pushed toward $1.28 and failed. A later recovery attempt reached around $1.25 before sellers regained control. Another move stalled near $1.22. Each rally reached a lower peak than the previous one.

That sequence often points to fading buying strength. Support levels eventually become vulnerable when buyers cannot produce stronger recoveries.

Martini Guy noted that he does not see aggressive demand returning to the market at current levels. Unless XRP can reclaim $1.15 quickly, he believes the decline could continue before any meaningful recovery develops.

Technical Support Around $1 Could Decide the Next Major XRP Price Move

A look at the XRP chart shows that support around $1.13 has already been holding on the 4 hour timeframe.

That level remains important because it currently represents the first line of defense for buyers. Continued weakness could place additional pressure on XRP price and open the door to a move toward the $1 region.

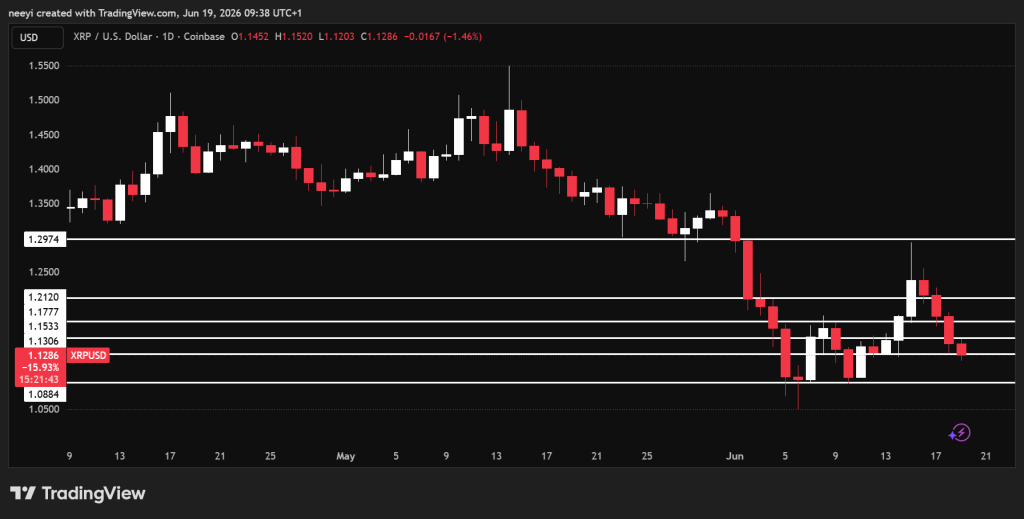
XRP Price Chart / TradingView.com

The $1 level carries special importance because XRP has not traded below that area since November 2024. Markets often remember major support zones that have held for extended periods. Buyers frequently return to those levels to defend them.

Price action around $1 could determine whether XRP experiences a temporary correction or a deeper decline.

Bitcoin may also play a major role. XRP continues to maintain a strong relationship with broader crypto market sentiment. Additional weakness in BTC could place further pressure on Ripple and many other altcoins.

Should Bitcoin lose more support levels, XRP price may find it difficult to avoid another leg lower.

Ali Charts Sees a Potential Opportunity if XRP Price Reaches $0.90

Despite the recent weakness, Ali Charts believes an important opportunity could emerge if XRP declines further.

The analyst stated that he is watching the $0.90 level closely. He views that area as a potentially compelling long term buying opportunity if XRP reaches it.

That outlook does not necessarily mean XRP must fall to $0.90. Instead, it identifies a zone where historical demand could become more attractive for investors seeking value after an extended decline.

Read Also: Kaspa Price Prediction: Why KAS Could Be Recreating Solana’s Early Bull Run Setup

Current market conditions still place greater attention on the support levels above that area. XRP first needs to defend $1.13 and then the psychologically important $1 mark.

Failure at those levels could bring Ali’s target into focus much faster. Several factors now point toward a critical period for Ripple and XRP price. Network activity has weakened considerably. Recovery attempts continue to lose strength. Major support levels are now under pressure.

FAQs

Will XRP make you a millionaire?

XRP can theoretically make you a millionaire, but it is highly unlikely to happen with a small initial investment, as it would require the asset’s market value to reach unprecedented, unrealistic levels. 

How much will $1000 of XRP be worth in 2030?

By 2030, 1,000 XRP could be worth anywhere from $2,000 to $28,000, with most mainstream financial analysts forecasting a value between $5,000 and $15,000. Because this is a highly speculative long-term projection, market opinions vary wildly regarding Ripple’s regulatory hurdles and future adoption.

Subscribe to our YouTube channel for daily crypto updates, market insights, and expert analysis.

The post XRP Price Headed for Its Biggest Test Since 2024 as Network Activity Crashes appeared first on CaptainAltcoin.

Piyasa Fırsatı
XRP Logosu
XRP Fiyatı(XRP)
$1.1372
$1.1372$1.1372
-0.07%
USD
XRP (XRP) Canlı Fiyat Grafiği

World Cup Combo: Aim for 200x

World Cup Combo: Aim for 200xWorld Cup Combo: Aim for 200x

Combine up to 20 World Cup matches in one order

Sorumluluk Reddi: Bu sitede yeniden yayınlanan makaleler, halka açık platformlardan alınmıştır ve yalnızca bilgilendirme amaçlıdır. MEXC'nin görüşlerini yansıtmayabilir. Tüm hakları telif sahiplerine aittir. Herhangi bir içeriğin üçüncü taraf haklarını ihlal ettiğini düşünüyorsanız, kaldırılması için lütfen crypto.news@mexc.com ile iletişime geçin. MEXC, içeriğin doğruluğu, eksiksizliği veya güncelliği konusunda hiçbir garanti vermez ve sağlanan bilgilere dayalı olarak alınan herhangi bir eylemden sorumlu değildir. İçerik, finansal, yasal veya diğer profesyonel tavsiye niteliğinde değildir ve MEXC tarafından bir tavsiye veya onay olarak değerlendirilmemelidir.

Ayrıca Şunları da Beğenebilirsiniz

Ethereum koers toont zeldzaam dubbel koopsignaal en richt zich op $4.550

Ethereum koers toont zeldzaam dubbel koopsignaal en richt zich op $4.550

Connect met Like-minded Crypto Enthusiasts! Connect op Discord! Check onze Discord   Ethereum laat op de uurgrafiek twee opeenvolgende TD Sequential koopsignalen zien. Deze indicator meet uitputting in een trend en geeft vaak een signaal dat de verkoopdruk kan afnemen. Dit dubbele signaal verschijnt rond het niveau van $4.516, waar de ETH prijs kortstondig steun vindt. Dit type formatie komt zelden voor en wordt daarom extra nauwlettend gevolgd. Wat gaat de Ethereum koers hiermee doen? Ethereum koers test steun rond $4.516 De scherpe daling van de Ethereum koers vanaf de prijszone rond $4.800 bracht de ETH prijs in korte tijd naar ongeveer $4.516. Op dit niveau trad duidelijke koopactiviteit op, waardoor de neerwaartse beweging tijdelijk werd gestopt. Het dubbele signaal dat door de TD Sequential indicator is gegenereerd, viel precies samen met dit prijspunt. De TD Sequential is opgebouwd uit negen candles die een trend meetellen. Wanneer de negende candle verschijnt, kan dit duiden op een trendomslag. In dit geval verschenen zelfs twee signalen kort na elkaar, wat aangeeft dat de verkoopdruk mogelijk uitgeput is. Het feit dat dit gebeurde in een zone waar ETH kopers actief bleven, maakt het patroon extra opvallend. TD Sequential just flashed two buy signals for Ethereum $ETH! pic.twitter.com/JPO8EhiEPi — Ali (@ali_charts) September 16, 2025 Welke crypto nu kopen?Lees onze uitgebreide gids en leer welke crypto nu kopen verstandig kan zijn! Welke crypto nu kopen? Fed-voorzitter Jerome Powell heeft aangekondigd dat de rentes binnenkort zomaar eens omlaag zouden kunnen gaan, en tegelijkertijd blijft BlackRock volop crypto kopen, en dus lijkt de markt klaar om te gaan stijgen. Eén vraag komt telkens terug: welke crypto moet je nu kopen? In dit artikel bespreken we de munten die… Continue reading Ethereum koers toont zeldzaam dubbel koopsignaal en richt zich op $4.550 document.addEventListener('DOMContentLoaded', function() { var screenWidth = window.innerWidth; var excerpts = document.querySelectorAll('.lees-ook-description'); excerpts.forEach(function(description) { var excerpt = description.getAttribute('data-description'); var wordLimit = screenWidth wordLimit) { var trimmedDescription = excerpt.split(' ').slice(0, wordLimit).join(' ') + '...'; description.textContent = trimmedDescription; } }); }); Technische indicatoren schetsen herstelkans voor ETH Naast de dubbele koopsignalen verstrekken ook andere indicatoren belangrijke aanwijzingen. Tijdens de daling van de ETH koers waren grote rode candles zichtbaar, maar na de test van $4.516 stabiliseerde de Ethereum koers. Dit wijst op een mogelijke verschuiving in het evenwicht tussen de bears en bulls. Als deze opwaartse beweging doorzet, liggen de eerste weerstanden rond $4.550. Daarboven wacht een sterkere zone rond $4.650. Deze niveaus zijn in eerdere Ethereum sessies al meerdere keren getest. Een doorbraak zou ruimte openen richting de all-time high van ETH rond $4.953. Wanneer de prijs toch opnieuw onder $4.516 zakt, liggen er zones rond $4.500 en $4.450 waar grotere kooporders worden verwacht. Deze niveaus kunnen als een vangnet fungeren, mocht de druk opnieuw toenemen. Marktdynamiek bevestigt technische indicatoren De huidige situatie volgt op een bredere correctie in de cryptomarkt. Verschillende vooraanstaande crypto tokens zagen scherpe koersdalingen, waarna traders op zoek gingen naar signalen voor een mogelijke ommekeer. Dat juist Ethereum nu een dubbel TD Sequential signaal toont, versterkt de interesse in dit scenario. Fundamenteel blijft Ethereum sterk. Het aantal ETH tokens dat via staking is vastgezet, blijft groeien. Dat verkleint de vrije circulatie en vermindert verkoopdruk. Tegelijk blijft het netwerk intensief gebruikt voor DeFi, NFT’s en stablecoins. Deze activiteiten zorgen voor een stabiele vraag naar ETH, ook wanneer de prijs tijdelijk onder druk staat. Fundamentele drijfveren achter de Ethereum koers De Ethereum koers wordt echter niet alleen bepaald door candles en patronen, maar ook door bredere factoren. Een stijgend percentage van de totale ETH supply staat vast in staking contracten. Hierdoor neemt de liquiditeit op exchanges af. Dit kan prijsschommelingen versterken wanneer er plotseling meer koopdruk ontstaat. Daarnaast is Ethereum nog steeds het grootste smart contract platform. Nieuwe standaarden zoals ERC-8004 en ontwikkelingen rond layer-2 oplossingen houden de activiteit hoog. Deze technologische vooruitgang kan de waardepropositie ondersteunen en zo indirect bijdragen aan een ETH prijsherstel. Het belang van de korte termijn dynamiek De komende handelsdagen zullen duidelijk maken of de bulls genoeg kracht hebben om door de weerstandszone rond $4.550 te breken. Voor de bears ligt de focus juist op het verdedigen van de prijsregio rond $4.516. De whales, die met grote handelsorders opereren, kunnen hierin een beslissende rol spelen. Het dubbele TD Sequential signaal blijft hoe dan ook een zeldzame gebeurtenis. Voor cryptoanalisten vormt het een objectief aanknopingspunt om de kracht van de huidige Ethereum trend te toetsen. Vooruitblik op de ETH koers Ethereum liet twee opeenvolgende TD Sequential signalen zien op de uurgrafiek, iets wat zelden voorkomt. Deze formatie viel samen met steun rond $4.516, waar de bulls actief werden. Als de Ethereum koers boven dit niveau blijft, kan er ruimte ontstaan richting $4.550 en mogelijk $4.650. Zakt de prijs toch opnieuw onder $4.516, dan komen $4.500 en $4.450 in beeld als nieuwe steunzones. De combinatie van zeldzame indicatoren en een sterke fundamentele basis maakt Ethereum interessant voor zowel technische als fundamentele analyses. Of de bulls het momentum echt kunnen overnemen, zal blijken zodra de Ethereum koers de eerstvolgende weerstanden opnieuw test. Koop je crypto via Best Wallet Best wallet is een topklasse crypto wallet waarmee je anoniem crypto kan kopen. Met meer dan 60 chains gesupport kan je al je main crypto coins aanschaffen via Best Wallet. Best wallet - betrouwbare en anonieme wallet Best wallet - betrouwbare en anonieme wallet Meer dan 60 chains beschikbaar voor alle crypto Vroege toegang tot nieuwe projecten Hoge staking belongingen Lage transactiekosten Best wallet review Koop nu via Best Wallet Let op: cryptocurrency is een zeer volatiele en ongereguleerde investering. Doe je eigen onderzoek. Het bericht Ethereum koers toont zeldzaam dubbel koopsignaal en richt zich op $4.550 is geschreven door Dirk van Haaster en verscheen als eerst op Bitcoinmagazine.nl.
Paylaş
Coinstats2025/09/17 23:31
UK Gilt Yields Spike As Burnham Win Opens Door To Oust Starmer

UK Gilt Yields Spike As Burnham Win Opens Door To Oust Starmer

UK Gilt Yields Spike As Burnham Win Opens Door To Oust Starmer The odds of embattled UK Prime Minister Keir Starmer being ousted by the end of July
Paylaş
ZeroHedge2026/06/19 21:05
HashKey Capital’s Strategic $540K STO Deposit to Binance Reveals Institutional Crypto Moves Amid Market Turmoil

HashKey Capital’s Strategic $540K STO Deposit to Binance Reveals Institutional Crypto Moves Amid Market Turmoil

BitcoinWorld HashKey Capital’s Strategic $540K STO Deposit to Binance Reveals Institutional Crypto Moves Amid Market Turmoil Institutional cryptocurrency investment
Paylaş
bitcoinworld2026/04/02 18:15

Score Your Share of 50K USDT

Score Your Share of 50K USDTScore Your Share of 50K USDT

Complete DEX+ tasks to unlock the Champion Wheel