VVV price rose for six consecutive days, reaching its highest level since May 12, as whales and smart money buy ahead of the tokenized DIEM launch. Venice Token (VVV) jumped to a high of $4.25, up by 80% from its…VVV price rose for six consecutive days, reaching its highest level since May 12, as whales and smart money buy ahead of the tokenized DIEM launch. Venice Token (VVV) jumped to a high of $4.25, up by 80% from its…

VVV price rises as whales buy ahead of Venice tokenized DIEM launch

2025/08/20 22:30

VVV price rose for six consecutive days, reaching its highest level since May 12, as whales and smart money buy ahead of the tokenized DIEM launch.

Summary
  • Venice Token price jumped to its highest point since May. 
  • Whale and smart money accumulation accelerated this week.
  • The developers are launching the tokenized DIEM on Aug. 20.

Venice Token (VVV) jumped to a high of $4.25, up by 80% from its lowest level this month. This surge brought its market capitalization to over $130 million.

Whales and smart money investors are buying Venice Token

Venice is a fast-growing player in the artificial intelligence industry that is building an alternative to popular platforms like ChatGPT and Grok. 

Its main advantage is that it focuses on privacy, where all users’ searches are saved on their browsers and not on Venice’s servers. It does not censor information.

VVV price has jumped recently as data show that whales are actively accumulating it. Nansen data reveals that whales hold 80,000 tokens, up from 66,000 earlier this month. Smart money investors’ holdings have jumped by 306% in the last 30 days to over 127,000.

The ongoing whale buying happened as the amount of VVV tokens on exchanges has plunged. There are now 2.2 million tokens, down from 4 million in July. Falling exchange reserves are a sign that investors are actively accumulating the token.

The next key catalyst for the VVV price is the launch of the tokenized DIEM and a tweak in its tokenomics. In this, VVV stakers will be able to mint DIEM tokens, a process that will replace the previous model where users received a daily allocation of DIEM tokens.

The advantage of this approach is that the allocated API capacity will no longer fluctuate and that users can sell their DIEM in the open market.

VVV price technical analysis

VVV price

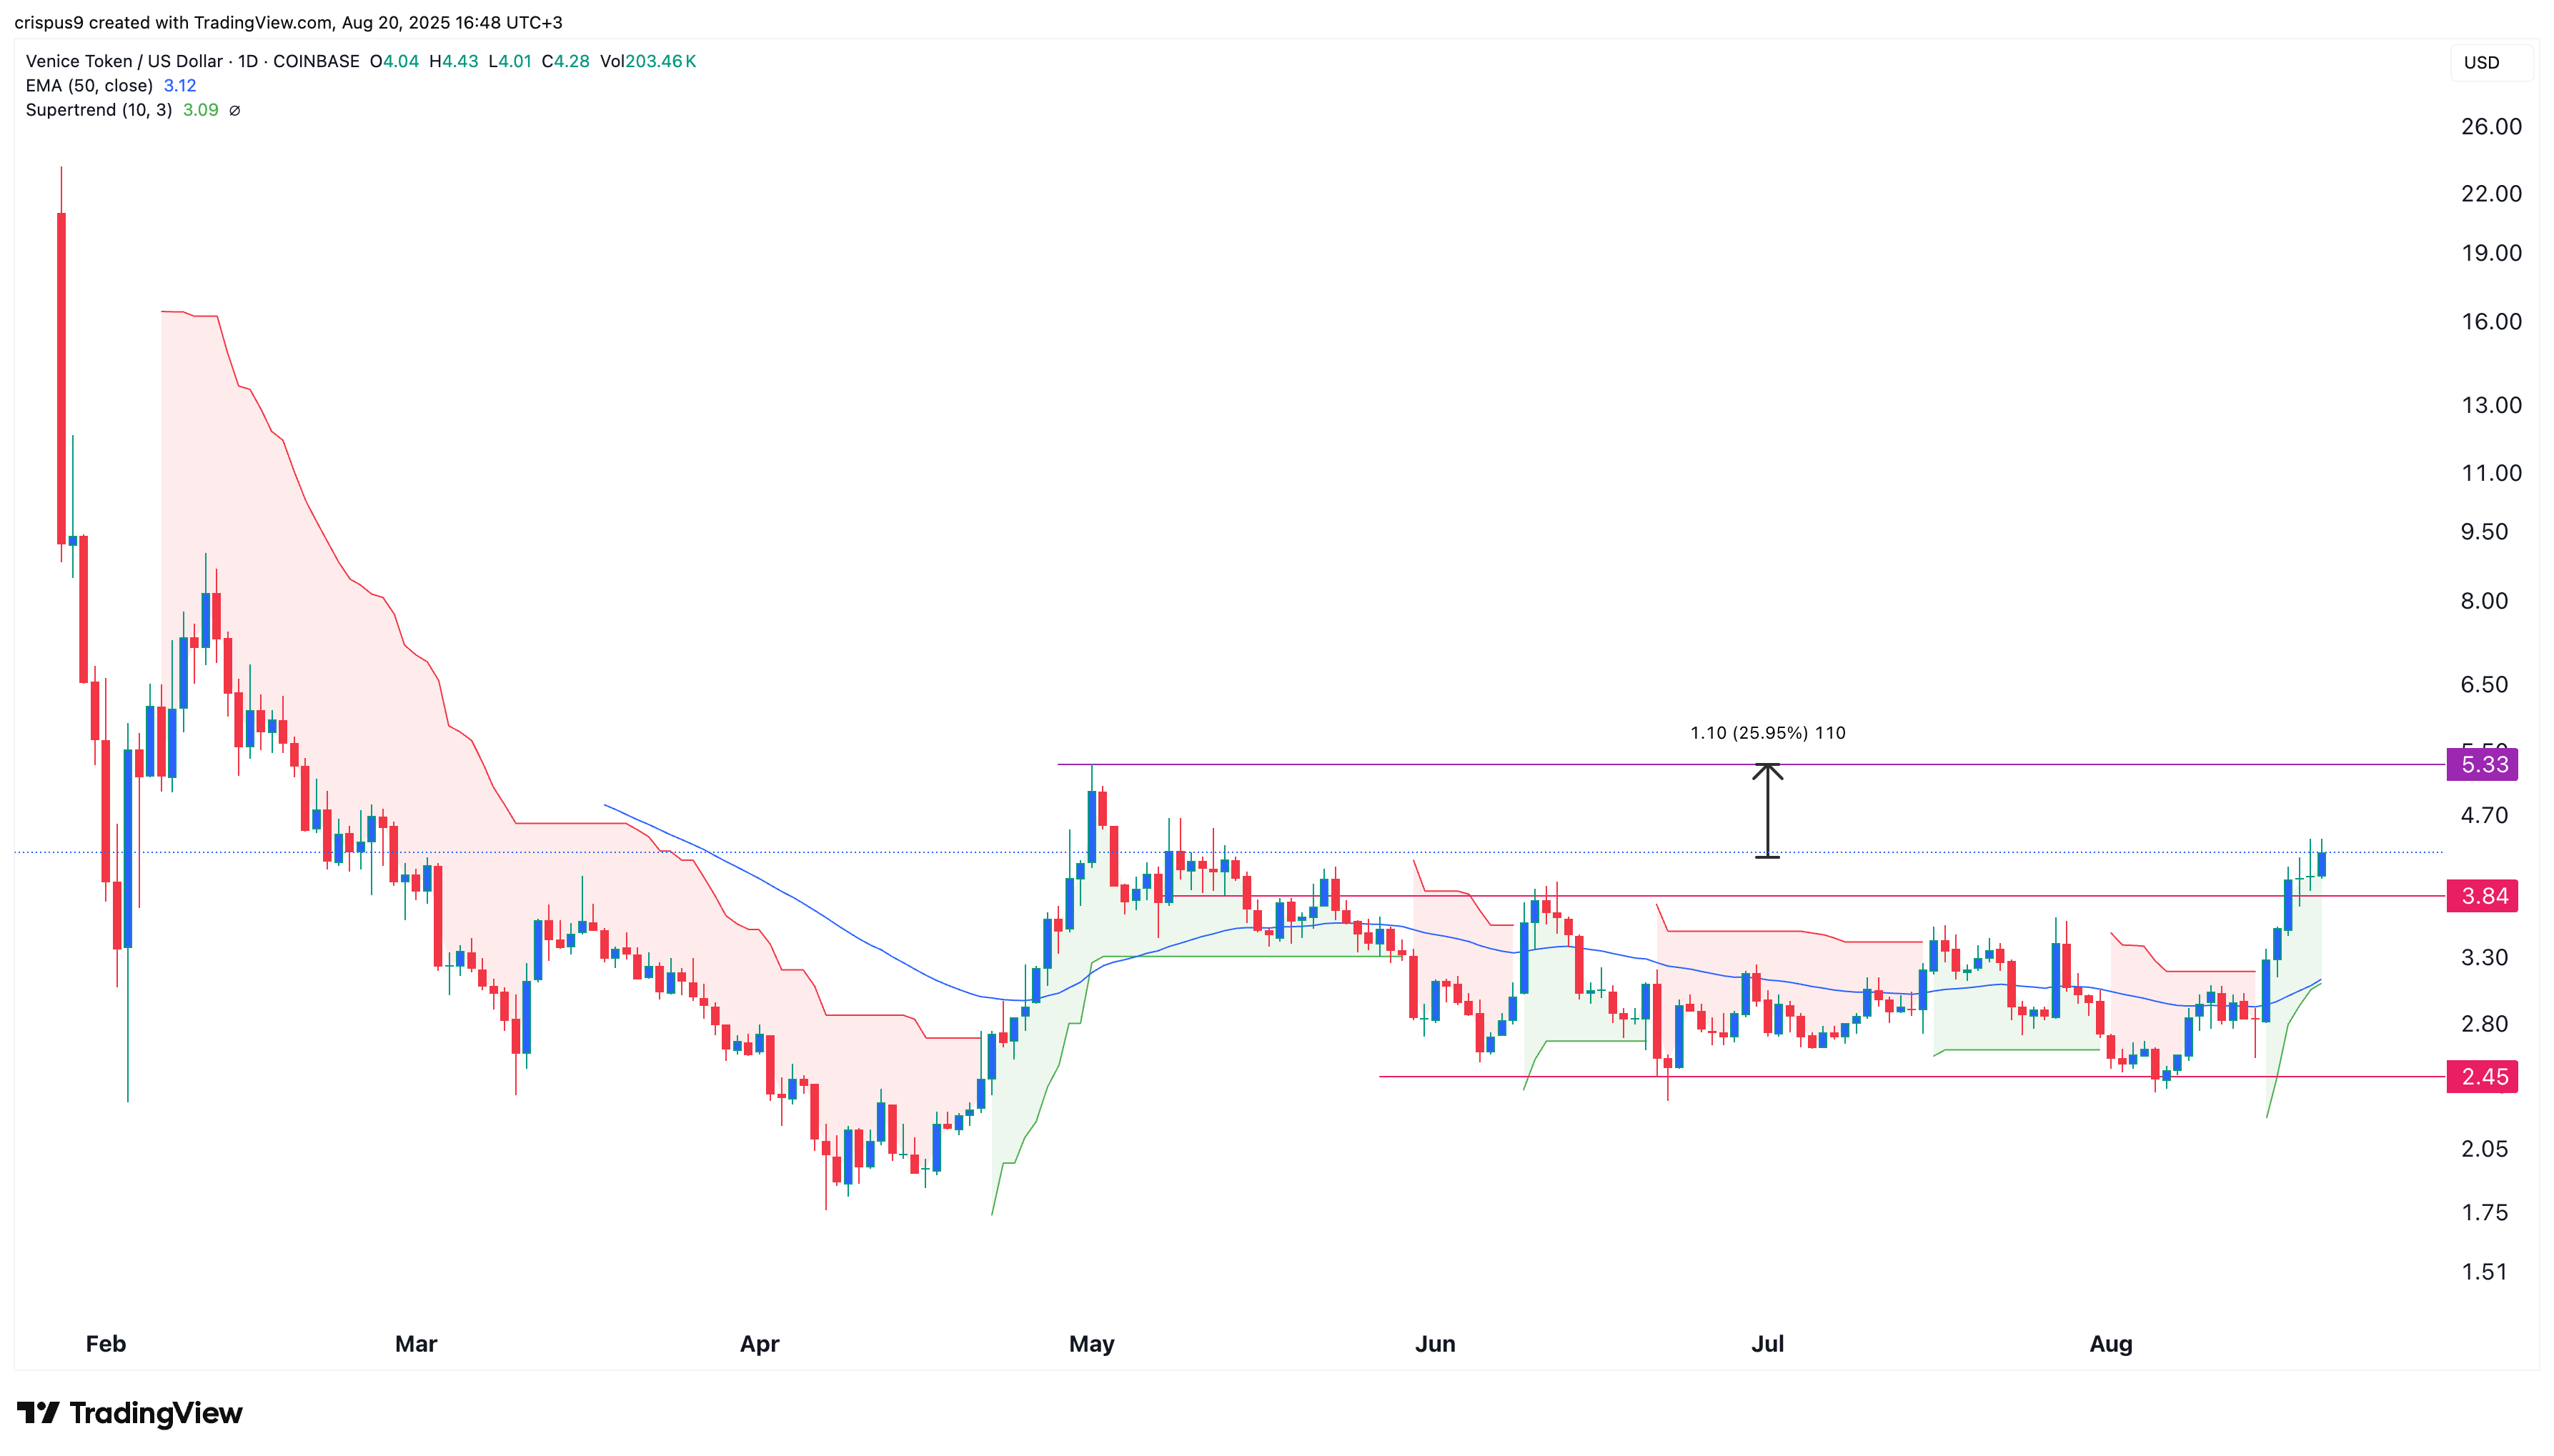
The daily chart shows that the VVV price has jumped in the past few days. This rebound happened after it formed a double-bottom pattern at $2.45. 

Venice Token has now crossed the important resistance level at $3.85, the neckline of this pattern. It has also moved above the 50-day Exponential Moving Average, while the Supertrend has turned green. 

Therefore, the most likely scenario is that the price keeps rising, with the next point to watch being at $5.33, its highest point on May 1, which is 25% above the current level.

Disclaimer: The articles reposted on this site are sourced from public platforms and are provided for informational purposes only. They do not necessarily reflect the views of MEXC. All rights remain with the original authors. If you believe any content infringes on third-party rights, please contact service@support.mexc.com for removal. MEXC makes no guarantees regarding the accuracy, completeness, or timeliness of the content and is not responsible for any actions taken based on the information provided. The content does not constitute financial, legal, or other professional advice, nor should it be considered a recommendation or endorsement by MEXC.
Share Insights

You May Also Like

Microsoft Corp. $MSFT blue box area offers a buying opportunity

Microsoft Corp. $MSFT blue box area offers a buying opportunity

The post Microsoft Corp. $MSFT blue box area offers a buying opportunity appeared on BitcoinEthereumNews.com. In today’s article, we’ll examine the recent performance of Microsoft Corp. ($MSFT) through the lens of Elliott Wave Theory. We’ll review how the rally from the April 07, 2025 low unfolded as a 5-wave impulse followed by a 3-swing correction (ABC) and discuss our forecast for the next move. Let’s dive into the structure and expectations for this stock. Five wave impulse structure + ABC + WXY correction $MSFT 8H Elliott Wave chart 9.04.2025 In the 8-hour Elliott Wave count from Sep 04, 2025, we saw that $MSFT completed a 5-wave impulsive cycle at red III. As expected, this initial wave prompted a pullback. We anticipated this pullback to unfold in 3 swings and find buyers in the equal legs area between $497.02 and $471.06 This setup aligns with a typical Elliott Wave correction pattern (ABC), in which the market pauses briefly before resuming its primary trend. $MSFT 8H Elliott Wave chart 7.14.2025 The update, 10 days later, shows the stock finding support from the equal legs area as predicted allowing traders to get risk free. The stock is expected to bounce towards 525 – 532 before deciding if the bounce is a connector or the next leg higher. A break into new ATHs will confirm the latter and can see it trade higher towards 570 – 593 area. Until then, traders should get risk free and protect their capital in case of a WXY double correction. Conclusion In conclusion, our Elliott Wave analysis of Microsoft Corp. ($MSFT) suggested that it remains supported against April 07, 2025 lows and bounce from the blue box area. In the meantime, keep an eye out for any corrective pullbacks that may offer entry opportunities. By applying Elliott Wave Theory, traders can better anticipate the structure of upcoming moves and enhance risk management in volatile markets. Source: https://www.fxstreet.com/news/microsoft-corp-msft-blue-box-area-offers-a-buying-opportunity-202509171323
Share
BitcoinEthereumNews2025/09/18 03:50