

Aave Struggles Below $200 as Bulls Aim for $243.50 Recovery Target
- Aave experiences an 8.33% daily and 15.84% weekly price decline.
- Market volatility increases amid growing selling pressure.
- Chainlink ACE integration boosts Aave’s institutional prospects.
- Technical signals hint at a possible rebound despite the bearish trend.
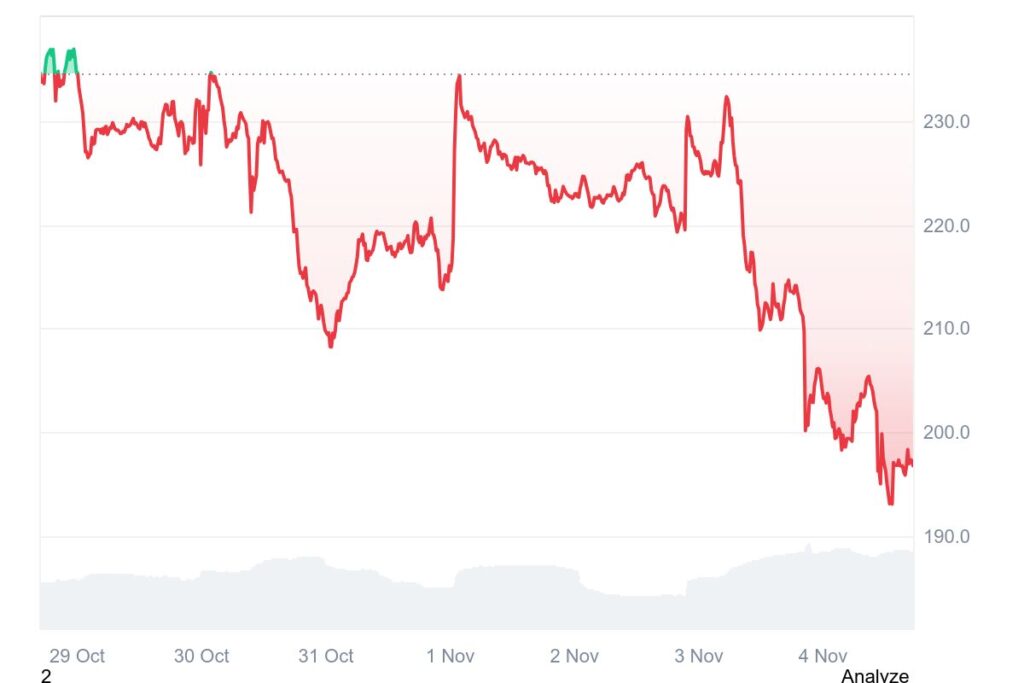
Aave is experiencing a notable pullback after facing renewed bearish pressure in the market. The token has dropped by nearly 8.33% in the past 24 hours and about 15.84% over the week. This consistent decline highlights growing selling pressure and short-term uncertainty in the token’s market performance.
 Source: CoinMarketCap
At press time, the token is trading at $196.77 with a 24-hour trading volume of $422.09 million, marking a 2.52% increase in trading activity from the previous day. Its market capitalization stands at $3 billion, down 8.32%, indicating a temporary pullback amid ongoing market volatility.
Also Read: AAVE Eyes Major Breakout Level With $628 and Beyond in Sight
Aave Gains Institutional Edge with Chainlink ACE Integration
Aave Horizon’s integration with Chainlink’s Automated Compliance Engine (ACE) has fueled optimism around the token’s price outlook. The collaboration enables institutional access to secure and regulation-compliant DeFi markets, expanding Aave’s real-world asset (RWA) lending potential. This development strengthens investor confidence and could drive new capital inflows into Aave’s ecosystem.
By adopting Chainlink ACE, Aave gains a strategic edge in merging traditional finance with decentralized protocols. This is because it promotes compliant markets for tokenized assets and increases the legitimacy of the Aave token among the traditional finance community. Also, increased adoption at the institutional level means that increased demand could drive the price of the token up.
Technical Indicators Point to Potential Reversal
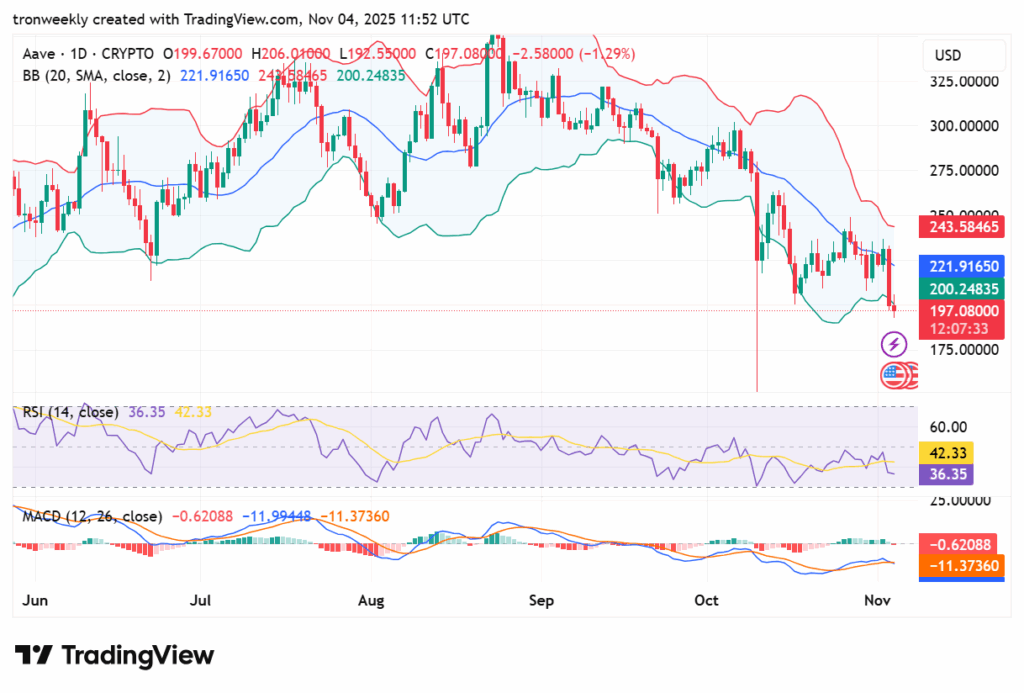
From a technical viewpoint, the token is still under pressure with the price falling below the middle Bollinger Band at $221.91 and inching closer to the lower band at $200.24. The increasing width of the bands indicates growing volatility and strong bearish momentum. A fall below the level of $195 could see it test levels below at the support zone of $175-$180.
The RSI is at 36.35, close to oversold levels, indicative of fading selling momentum and a bounce if buying support revives. The MACD is also reflecting the closing of the bearish gap, signifying a possible stabilization.
 Source: TradingView
Overall, the short-term prospects of the token continue to be bearish but on the edge of a short-term comeback. Crossing the crucial level of $210 could be a precursor to begin with the formation of a consolidation pattern before another push towards the target of $243.50. Until now, there has been cautious optimism as the token is navigating through increased market volatility.
Also Read: Aave Labs Acquires Stable Finance to Lead $300 Billion Stablecoin Market Expansion
You May Also Like
Shiba Inu Faces Growing Risks as Leadership Instability Concerns Holders

Antalpha: Gold RWA is the best paradigm for the digital reconstruction of real-world assets.

