Hedera Price Prediction: Can HBAR Recover In April Or Slide Lower?
Hedera has slipped below a level that held firm for most of March, and that quiet breakdown now puts HBAR price at a sensitive point heading into April. The move has not been dramatic, yet the structure shows a steady loss of strength that cannot be ignored.
The past month outlines a clear path. Hedera moved from around $0.10 earlier in March toward $0.084 now, with repeated failures to hold higher levels and a gradual push toward lower ground.
The last 30 days reveal a pattern that often precedes a larger move. HBAR price formed lower highs close to $0.10 and kept returning to the $0.088 area until that level eventually gave way.
This type of price action points to a controlled downtrend instead of a sudden collapse. The difference matters because gradual weakness often leads to a key support test before a stronger move develops.
| Category | Level / Value | What It Means For HBAR Price |
|---|---|---|
| Current Price | ~$0.085 | Trading below key support, showing weakness |
| Trend (30 Days) | Lower highs from ~$0.10 | Controlled downtrend still in place |
| 7-Day SMA | ~$0.0906 | First dynamic resistance level |
| 30-Day SMA | ~$0.0944 | Trend decision zone |
| 200-Day SMA | ~$0.1393 | Long-term resistance, shows macro weakness |
| Structure Summary | Bearish below $0.095 | Trend remains weak unless reclaimed |
| Key Trigger (Bullish) | Hold above ~$0.095 | Signals weakening downtrend |
Price now sits below the 7-day and 30-day moving averages, which reinforces the bearish structure. The 200-day moving average remains far above at $0.1393, showing how far the current trend sits from a broader recovery phase.
The zone around $0.085 now becomes the immediate focus. Holding this level could allow price to stabilize, while losing it could open the door to deeper downside.
Key Hedera Price Levels Define The Direction For April
HBAR price trades around $0.085, which places it just under the previous monthly floor. The range between $0.085 and $0.088 now acts as a support or breakdown zone.
A sustained move below this range would confirm that the prior support has turned into resistance and could push price toward the high $0.07s.
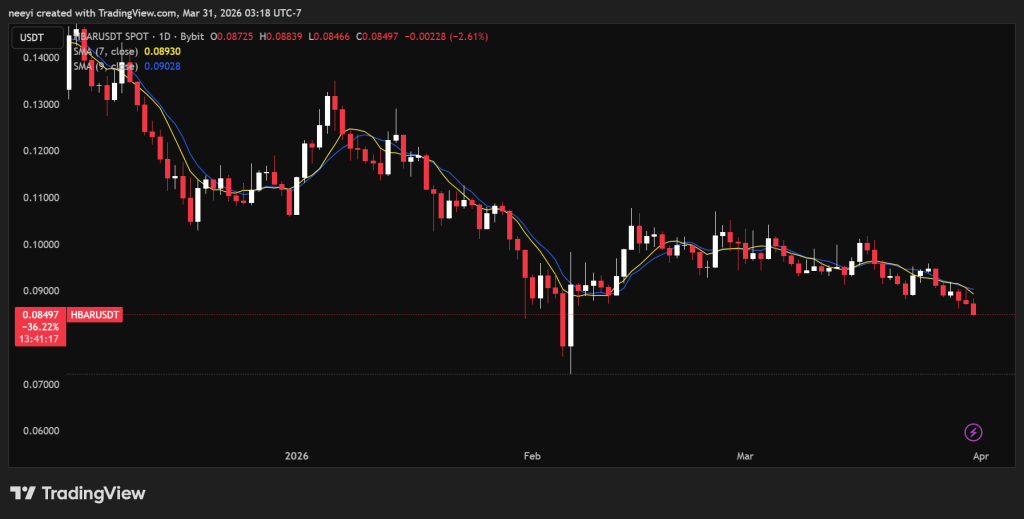 HBAR Price Chart Showing 7-Day and 30-Day SMAs / Source: TradingView.com
The first resistance sits between $0.088 and $0.091. This area includes the daily pivot and the 7-day moving average near $0.0906. Any bounce must break above this band to gain short-term strength.
A more important level appears higher. The zone between $0.093 and $0.095 aligns with the 30-day moving average and serves as the trend decision point. A move above it would weaken the current downtrend.
The upper resistance remains near $0.10 to $0.105. This area capped price throughout March, and another rejection there would likely maintain the broader structure.
Hedera Momentum Indicators Show Oversold Conditions With Weak Strength
Momentum indicators provide additional insight into the HBAR price outlook. Short-term RSI (7) sits near 24, which places the market in an oversold zone.
Longer period RSI (14) values remain weak, with readings near 34. These levels show that selling pressure still dominates, even though the market has reached a stretched condition.
MACD remains negative, though the magnitude stays small. This detail shows that the downtrend continues, yet it has not accelerated into a sharp breakdown.
This setup often leads to sideways movement or a temporary bounce toward nearby resistance levels.
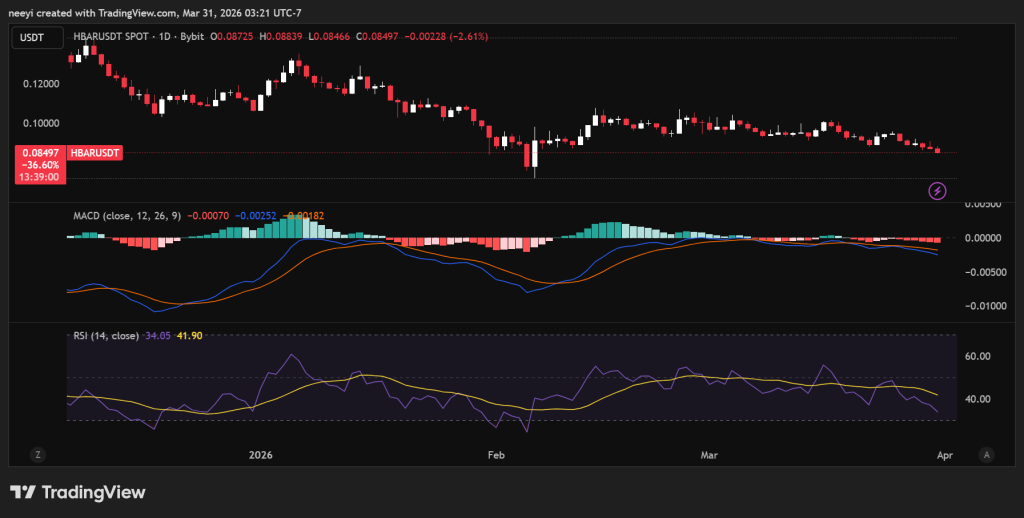 HBAR Price Chart Showing MACD and RSI Indicators / Source: TradingView.com
Fundamental And Macro Factors Could Influence Hedera Price In April
Technical structure alone does not determine how HBAR price will behave. Several broader factors could shape the outcome during April.
Enterprise adoption stands out as one of them. Projects tied to companies such as FedEx and Lloyds Banking Group could move toward full deployment, which may increase network activity.
Governance expansion also plays a role. Adding more global firms to Hedera’s council could strengthen institutional confidence and long term support.
Real-world asset tokenization continues to develop as well. Hedera has positioned itself in areas such as real estate and carbon credits, which could support demand over time.
Macroeconomic conditions remain important. Interest rate decisions and regulatory clarity could influence risk appetite across crypto markets. A stronger Bitcoin environment would likely support Hedera, while broader weakness could limit recovery attempts.
Read Also: Why Kaspa Isn’t “a Better Bitcoin”: Analyst Shuts Down the KAS vs BTC Narrative
Hedera Price Prediction For April Depends On Three Possible Scenarios
The outlook for April works best as a range of outcomes instead of a single target. Current data points to three main paths.
A base case scenario shows HBAR trading between $0.075 and $0.10. This outcome assumes the market remains mixed and Hedera fails to hold above the 30 day average for long.
A bullish scenario requires a reclaim of $0.093 to $0.095. Sustained strength above that zone could push HBAR toward $0.10 to $0.105 and possibly extend toward $0.13 if the bullish momentum persists.
A bearish scenario develops if price remains below $0.085. Continued weakness could lead to a range between $0.065 and $0.085, with deeper dips toward $0.060 under stronger pressure.
These scenarios create a broader envelope between $0.060 and $0.13 for April.
Subscribe to our YouTube channel for daily crypto updates, market insights, and expert analysis.
The post Hedera Price Prediction: Can HBAR Recover In April Or Slide Lower? appeared first on CaptainAltcoin.
You May Also Like

Aave DAO to Shut Down 50% of L2s While Doubling Down on GHO

New Crypto Investors Are Backing Layer Brett Over Dogecoin After Topping The Meme Coin Charts This Month