Pi Network is holding its ground even while the crypto market feels shaky. They just rolled out Protocol 20, which sets the stage for smart contracts and futurePi Network is holding its ground even while the crypto market feels shaky. They just rolled out Protocol 20, which sets the stage for smart contracts and future

ChatGPT Predicts Pi Coin Price if Bitcoin Hits a New All-Time High in 2026

2026/03/20 07:00
4 min read
For feedback or concerns regarding this content, please contact us at crypto.news@mexc.com

Pi Network is holding its ground even while the crypto market feels shaky. They just rolled out Protocol 20, which sets the stage for smart contracts and future apps.

The Pi Coin price might not look exciting right now, but the tech behind it is getting stronger. Even with the market down, Pi Coin has stayed relatively steady.

However, If Bitcoin and the broader market pick up, Pi could be ready to move.

What’s Going on With Bitcoin?

Bitcoin briefly broke past a key high but pulled back, hovering just below as traders take profits.

The market feels cautious. Trading is slower, ETFs are seeing outflows, and the Fed’s interest rates are keeping momentum in check.

Bitcoin is about 8% below its recent peak. Analysts are split, some see this as a healthy pause, while others worry it could be the start of a bigger drop.

If Bitcoin does break out and hits a new all-time high in 2026, coins like Pi could see some big moves.

Pi Coin Chart Analysis

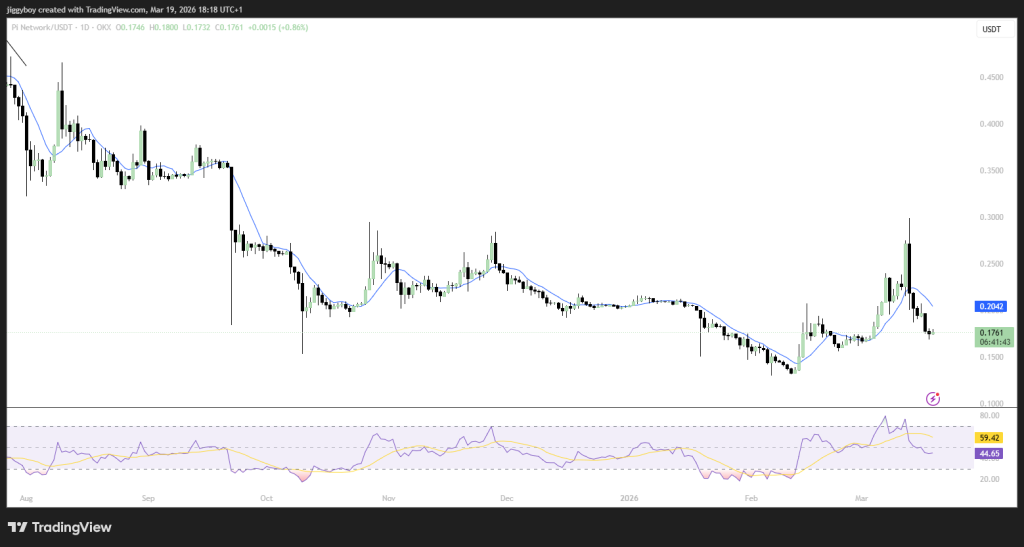
We took a look at the chart and Pi Coin has been in a clear downtrend for months, forming lower highs and lower lows. That kind of structure usually signals weak momentum.

However, something has started to change recently.

The Pi Coin price found has been supported in the range of $0.14 to $0.15, and from there, we can see that the price has started to bounce up, indicating that people are investing in this cryptocurrency at lower levels. 

There was a sharp rise in price to the range of $0.28, which shows that people are interested in investing in this cryptocurrency when there is momentum in the market.

Right now, Pi is trading around $0.17, just below a key moving average that’s acting as resistance. The RSI is around neutral, showing the market isn’t sure which way to go. In other words, Pi’s price is still weak, but it could be starting to form a base.

Source: TradingView.com

ChatGPT’s Pi Coin Price Predictions

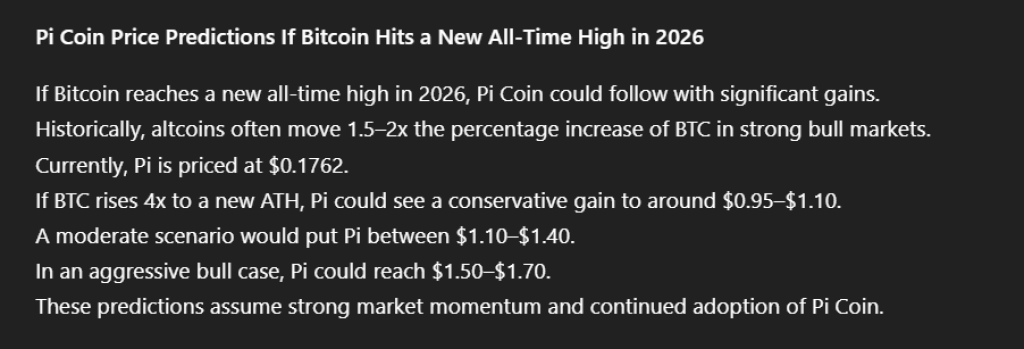
If Bitcoin enters a strong bull phase and reaches a new all-time high in 2026, Pi Coin could follow with huge gains.

Altcoins have traditionally appreciated more than the value of Bitcoin during robust markets, gaining 1.5 to 2 times the percentage increase of BTC.

Going forward, the price may behave in various ways depending on the behavior of the markets. Assuming a cautious case where the price of BTC increases, the price of Pi could be between $0.95 and $1.10.

In a moderate case, it may fluctuate in the range of $1.10 and $1.40 as more people use it and the momentum increases. And in a strong bull run, the Pi Coin price may go as high as $1.50 and $1.70.

All these are based on the continued development of the Pi Network and the overall market momentum.

Read Also: How Japan’s Rate Hikes Make XRP and Ripple’s ODL Essential

Source: ChatGPT

However, Pi Network is still early and a bit uncertain, especially looking at its chart. But its fundamentals are slowly improving, and the recent upgrade shows it’s moving forward.

If Bitcoin leads the market into a new bull run, Pi, like many other altcoins, could benefit too.The key factor will be whether it can maintain support and build real usage as its ecosystem grows.

For now, it’s a waiting game, but one that could become very interesting if the broader market turns bullish again.

Subscribe to our YouTube channel for daily crypto updates, market insights, and expert analysis.

The post ChatGPT Predicts Pi Coin Price if Bitcoin Hits a New All-Time High in 2026 appeared first on CaptainAltcoin.

Market Opportunity
Pi Network Logo
Pi Network Price(PI)
$0.19183
$0.19183$0.19183
+8.50%
USD
Pi Network (PI) Live Price Chart
Disclaimer: The articles reposted on this site are sourced from public platforms and are provided for informational purposes only. They do not necessarily reflect the views of MEXC. All rights remain with the original authors. If you believe any content infringes on third-party rights, please contact crypto.news@mexc.com for removal. MEXC makes no guarantees regarding the accuracy, completeness, or timeliness of the content and is not responsible for any actions taken based on the information provided. The content does not constitute financial, legal, or other professional advice, nor should it be considered a recommendation or endorsement by MEXC.

You May Also Like

BFX Presale Raises $7.5M as Solana Holds $243 and Avalanche Eyes $1B Treasury — Best Cryptos to Buy in 2025

BFX Presale Raises $7.5M as Solana Holds $243 and Avalanche Eyes $1B Treasury — Best Cryptos to Buy in 2025

BFX presale hits $7.5M with tokens at $0.024 and 30% bonus code BLOCK30, while Solana holds $243 and Avalanche builds a $1B treasury to attract institutions.
Share
Blockchainreporter2025/09/18 01:07
World Gold Council plans to build shared infrastructure platform for digital gold

World Gold Council plans to build shared infrastructure platform for digital gold

The post World Gold Council plans to build shared infrastructure platform for digital gold appeared on BitcoinEthereumNews.com. The World Gold Council (WGC), a
Share
BitcoinEthereumNews2026/03/20 14:45
Ethereum koers toont zeldzaam dubbel koopsignaal en richt zich op $4.550

Ethereum koers toont zeldzaam dubbel koopsignaal en richt zich op $4.550

Connect met Like-minded Crypto Enthusiasts! Connect op Discord! Check onze Discord   Ethereum laat op de uurgrafiek twee opeenvolgende TD Sequential koopsignalen zien. Deze indicator meet uitputting in een trend en geeft vaak een signaal dat de verkoopdruk kan afnemen. Dit dubbele signaal verschijnt rond het niveau van $4.516, waar de ETH prijs kortstondig steun vindt. Dit type formatie komt zelden voor en wordt daarom extra nauwlettend gevolgd. Wat gaat de Ethereum koers hiermee doen? Ethereum koers test steun rond $4.516 De scherpe daling van de Ethereum koers vanaf de prijszone rond $4.800 bracht de ETH prijs in korte tijd naar ongeveer $4.516. Op dit niveau trad duidelijke koopactiviteit op, waardoor de neerwaartse beweging tijdelijk werd gestopt. Het dubbele signaal dat door de TD Sequential indicator is gegenereerd, viel precies samen met dit prijspunt. De TD Sequential is opgebouwd uit negen candles die een trend meetellen. Wanneer de negende candle verschijnt, kan dit duiden op een trendomslag. In dit geval verschenen zelfs twee signalen kort na elkaar, wat aangeeft dat de verkoopdruk mogelijk uitgeput is. Het feit dat dit gebeurde in een zone waar ETH kopers actief bleven, maakt het patroon extra opvallend. TD Sequential just flashed two buy signals for Ethereum $ETH! pic.twitter.com/JPO8EhiEPi — Ali (@ali_charts) September 16, 2025 Welke crypto nu kopen?Lees onze uitgebreide gids en leer welke crypto nu kopen verstandig kan zijn! Welke crypto nu kopen? Fed-voorzitter Jerome Powell heeft aangekondigd dat de rentes binnenkort zomaar eens omlaag zouden kunnen gaan, en tegelijkertijd blijft BlackRock volop crypto kopen, en dus lijkt de markt klaar om te gaan stijgen. Eén vraag komt telkens terug: welke crypto moet je nu kopen? In dit artikel bespreken we de munten die… Continue reading Ethereum koers toont zeldzaam dubbel koopsignaal en richt zich op $4.550 document.addEventListener('DOMContentLoaded', function() { var screenWidth = window.innerWidth; var excerpts = document.querySelectorAll('.lees-ook-description'); excerpts.forEach(function(description) { var excerpt = description.getAttribute('data-description'); var wordLimit = screenWidth wordLimit) { var trimmedDescription = excerpt.split(' ').slice(0, wordLimit).join(' ') + '...'; description.textContent = trimmedDescription; } }); }); Technische indicatoren schetsen herstelkans voor ETH Naast de dubbele koopsignalen verstrekken ook andere indicatoren belangrijke aanwijzingen. Tijdens de daling van de ETH koers waren grote rode candles zichtbaar, maar na de test van $4.516 stabiliseerde de Ethereum koers. Dit wijst op een mogelijke verschuiving in het evenwicht tussen de bears en bulls. Als deze opwaartse beweging doorzet, liggen de eerste weerstanden rond $4.550. Daarboven wacht een sterkere zone rond $4.650. Deze niveaus zijn in eerdere Ethereum sessies al meerdere keren getest. Een doorbraak zou ruimte openen richting de all-time high van ETH rond $4.953. Wanneer de prijs toch opnieuw onder $4.516 zakt, liggen er zones rond $4.500 en $4.450 waar grotere kooporders worden verwacht. Deze niveaus kunnen als een vangnet fungeren, mocht de druk opnieuw toenemen. Marktdynamiek bevestigt technische indicatoren De huidige situatie volgt op een bredere correctie in de cryptomarkt. Verschillende vooraanstaande crypto tokens zagen scherpe koersdalingen, waarna traders op zoek gingen naar signalen voor een mogelijke ommekeer. Dat juist Ethereum nu een dubbel TD Sequential signaal toont, versterkt de interesse in dit scenario. Fundamenteel blijft Ethereum sterk. Het aantal ETH tokens dat via staking is vastgezet, blijft groeien. Dat verkleint de vrije circulatie en vermindert verkoopdruk. Tegelijk blijft het netwerk intensief gebruikt voor DeFi, NFT’s en stablecoins. Deze activiteiten zorgen voor een stabiele vraag naar ETH, ook wanneer de prijs tijdelijk onder druk staat. Fundamentele drijfveren achter de Ethereum koers De Ethereum koers wordt echter niet alleen bepaald door candles en patronen, maar ook door bredere factoren. Een stijgend percentage van de totale ETH supply staat vast in staking contracten. Hierdoor neemt de liquiditeit op exchanges af. Dit kan prijsschommelingen versterken wanneer er plotseling meer koopdruk ontstaat. Daarnaast is Ethereum nog steeds het grootste smart contract platform. Nieuwe standaarden zoals ERC-8004 en ontwikkelingen rond layer-2 oplossingen houden de activiteit hoog. Deze technologische vooruitgang kan de waardepropositie ondersteunen en zo indirect bijdragen aan een ETH prijsherstel. Het belang van de korte termijn dynamiek De komende handelsdagen zullen duidelijk maken of de bulls genoeg kracht hebben om door de weerstandszone rond $4.550 te breken. Voor de bears ligt de focus juist op het verdedigen van de prijsregio rond $4.516. De whales, die met grote handelsorders opereren, kunnen hierin een beslissende rol spelen. Het dubbele TD Sequential signaal blijft hoe dan ook een zeldzame gebeurtenis. Voor cryptoanalisten vormt het een objectief aanknopingspunt om de kracht van de huidige Ethereum trend te toetsen. Vooruitblik op de ETH koers Ethereum liet twee opeenvolgende TD Sequential signalen zien op de uurgrafiek, iets wat zelden voorkomt. Deze formatie viel samen met steun rond $4.516, waar de bulls actief werden. Als de Ethereum koers boven dit niveau blijft, kan er ruimte ontstaan richting $4.550 en mogelijk $4.650. Zakt de prijs toch opnieuw onder $4.516, dan komen $4.500 en $4.450 in beeld als nieuwe steunzones. De combinatie van zeldzame indicatoren en een sterke fundamentele basis maakt Ethereum interessant voor zowel technische als fundamentele analyses. Of de bulls het momentum echt kunnen overnemen, zal blijken zodra de Ethereum koers de eerstvolgende weerstanden opnieuw test. Koop je crypto via Best Wallet Best wallet is een topklasse crypto wallet waarmee je anoniem crypto kan kopen. Met meer dan 60 chains gesupport kan je al je main crypto coins aanschaffen via Best Wallet. Best wallet - betrouwbare en anonieme wallet Best wallet - betrouwbare en anonieme wallet Meer dan 60 chains beschikbaar voor alle crypto Vroege toegang tot nieuwe projecten Hoge staking belongingen Lage transactiekosten Best wallet review Koop nu via Best Wallet Let op: cryptocurrency is een zeer volatiele en ongereguleerde investering. Doe je eigen onderzoek. Het bericht Ethereum koers toont zeldzaam dubbel koopsignaal en richt zich op $4.550 is geschreven door Dirk van Haaster en verscheen als eerst op Bitcoinmagazine.nl.
Share
Coinstats2025/09/17 23:31