

Solana (SOL) Price: 800% Spike in Exchange Inflows Points to $65 Target
Quick Summary
- Solana has lost over 30% of its value year-to-date, with each recovery attempt ending at progressively lower peaks
- Negative funding rates have persisted for 21 consecutive weeks, echoing a 2022 pattern that preceded a significant bull run
- Open interest has plummeted from $7.58 billion down to $1.9 billion, reducing potential for a short squeeze rally
- Daily exchange deposits have exploded 800% since February, climbing from 245,691 SOL to more than 2.2 million SOL
- Critical support zones are located at $82 and $75, with a potential deeper decline to $65 if these levels fail
Over the last 30 days, Solana has maintained relative stability with only a 1.4% decline. However, zooming out reveals a more concerning trend. Since the start of 2026, SOL has shed over 30% of its value, with every upward movement stalling at progressively weaker resistance levels.
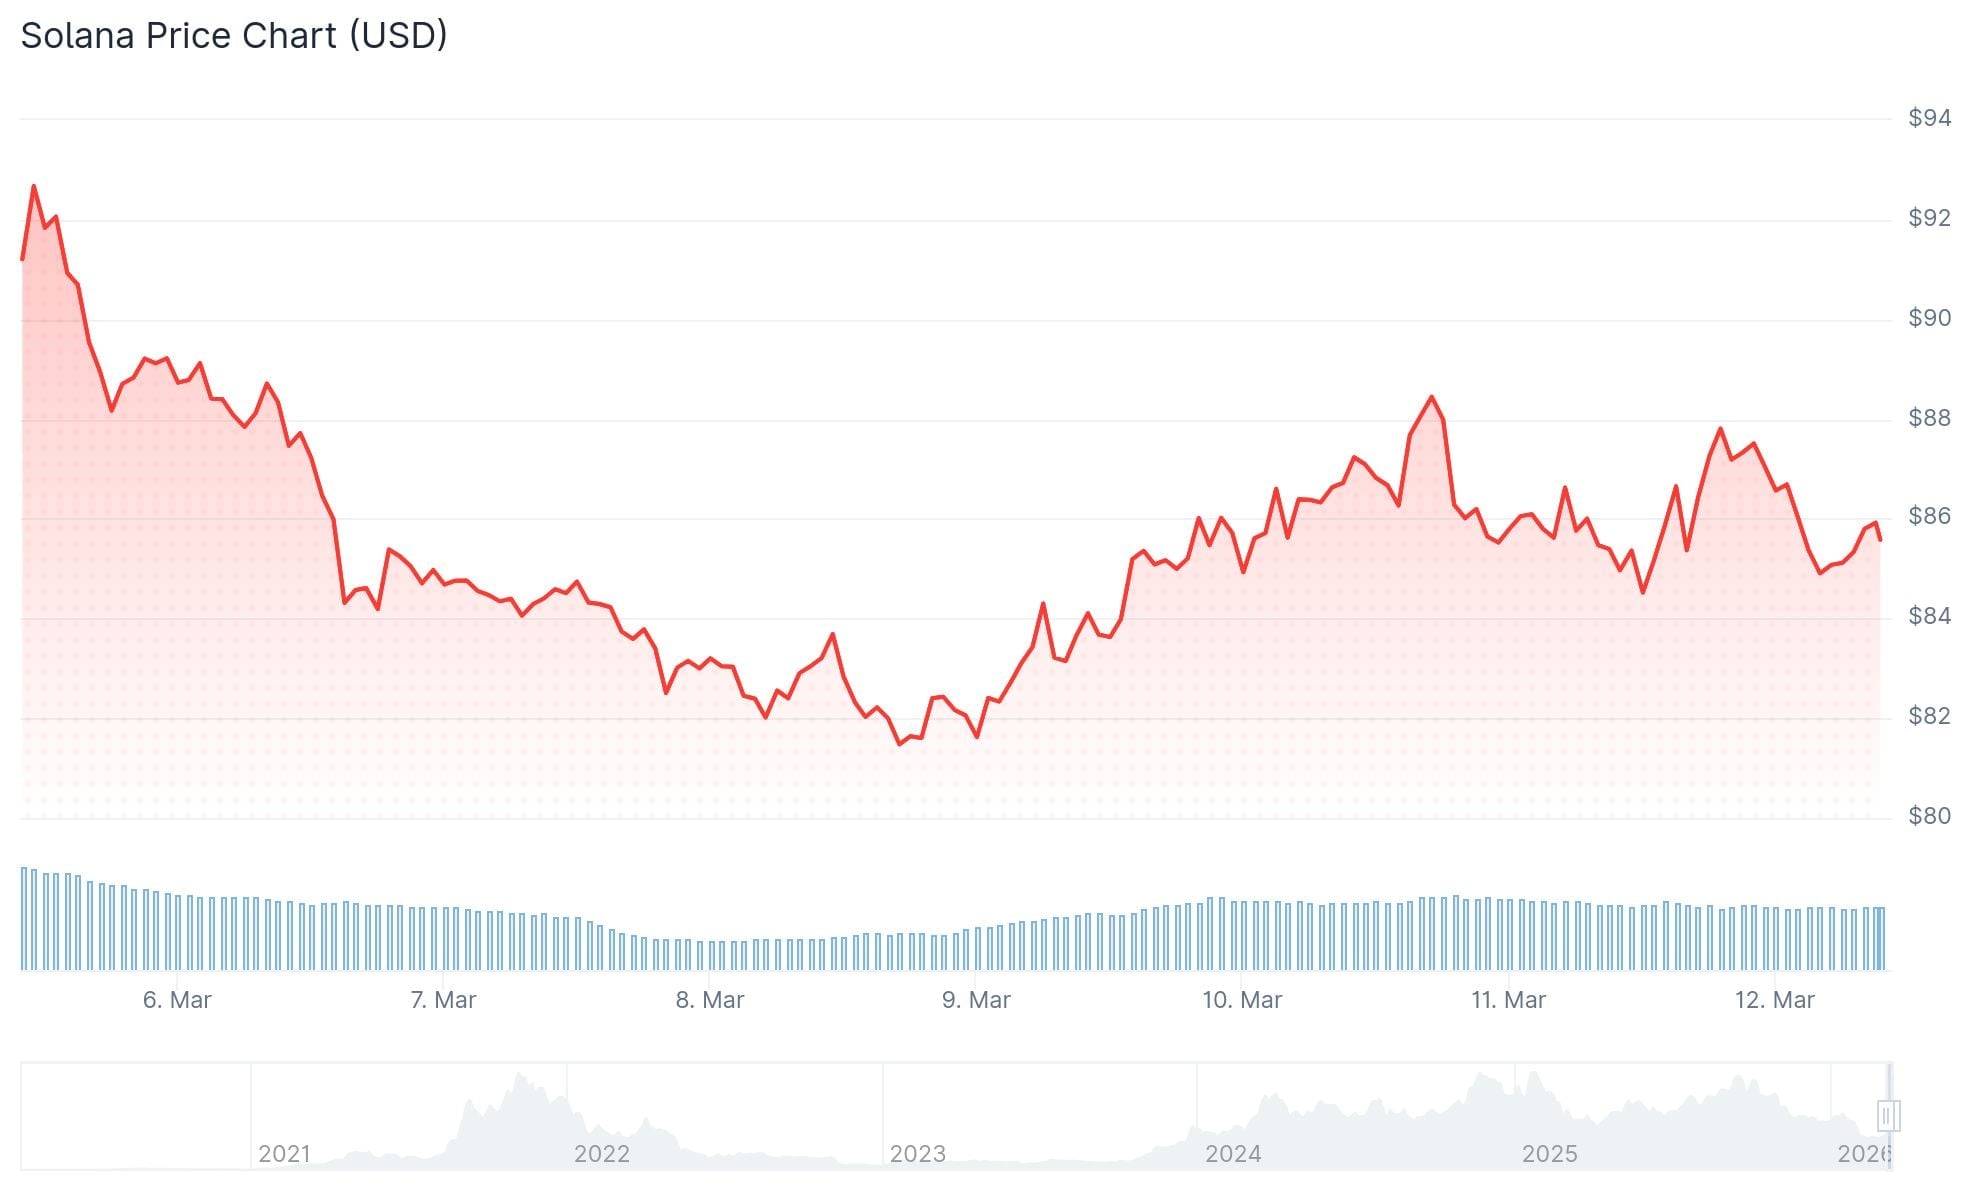 Solana (SOL) Price
Beneath the surface of this short-term stability, significant downward pressure continues to accumulate.
A critical futures market indicator — the funding rate — has remained in negative territory for 21 consecutive weeks. When funding rates turn negative, it indicates that traders holding short positions are compensating those with long positions to maintain their bets. This dynamic reflects a market heavily tilted toward bearish sentiment.
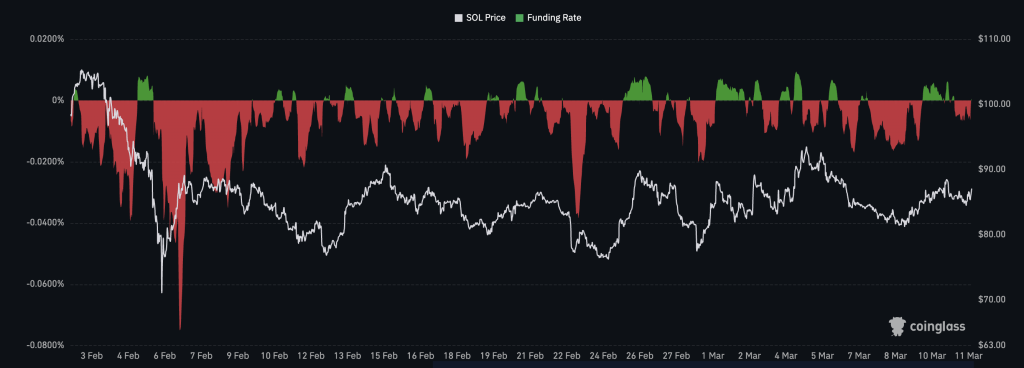 Source: Coinglass
A similar pattern emerged between February 2022 and February 2023, lasting 53 weeks. Throughout that period, SOL plummeted to a cycle bottom of $7. Yet as that negative funding streak concluded, the price began a quiet recovery phase — ultimately surging to $209 by March 2024.
The present 21-week negative funding streak shows structural similarities. However, one critical distinction sets it apart.
Derivatives Open Interest Has Evaporated
SOL derivatives open interest reached its zenith at $7.58 billion in September 2025. Currently, it hovers around $1.9 billion — marking the lowest level since early March 2025. This represents approximately a 75% contraction.
Reduced open interest indicates insufficient leveraged short positions to catalyze a substantial short squeeze. Without this catalyst, price recoveries typically lack momentum and fade quickly.
On the technical chart, SOL has been confined within an ascending channel formation since early February. While this might appear constructive, the channel developed immediately following a sharp collapse from $148 down to $68. Technical analysts interpret this as a bearish continuation structure — not a trend reversal signal.
 Source: TradingView
Tokens Flowing to Exchanges at Accelerating Pace
Blockchain data strengthens the bearish argument. Net Solana inflows to exchanges have registered positive readings consistently since February 10. At that time, daily inflows measured approximately 245,691 SOL. By March 10, that figure had surged to 2,204,783 SOL — representing an approximately 800% jump within a single month.
When tokens migrate onto exchanges in large volumes, it typically signals that holders are positioning to liquidate their positions.
For a genuine market bottom to establish itself, analysts emphasize that these inflows would need to shift into consistent outflows. That transition has yet to materialize.
Immediate support levels on the chart are positioned at $82, followed by $79. Should these zones fail to hold, the technical projection from the channel pattern targets $65.
On the resistance side, a daily closing price above $94 would disrupt the pattern of declining highs. A breakthrough above $118 would be required to validate a complete bullish trend reversal.
As of March 11, 2026, SOL is trading around $85, with exchange inflows continuing their upward trajectory and open interest remaining anchored near multi-month lows.
The post Solana (SOL) Price: 800% Spike in Exchange Inflows Points to $65 Target appeared first on Blockonomi.
You May Also Like

U.S. Dollar Surges: Critical Analysis as Oil Prices Skyrocket Past $100 a Barrel

Virginia Financial Educators Council Selects Ramona Jones, CEO of Jeunibe Financial Advisory, as Advisory Board Member
