

How does the US government put GDP data on the blockchain?
Written by AIMan, Golden Finance
The US government has taken another on-chain action.
On August 28, 2025, the U.S. Department of Commerce announced that it would publish real gross domestic product (GDP) data on nine blockchains starting in July 2025.
At the same time, Chainlink also announced a partnership with the U.S. Department of Commerce to upload six key U.S. economic data to 10 blockchains.
What's going on? Why are there different numbers of blockchains? How are they all uploaded? This article briefly explains.
Hash: US Department of Commerce puts GDP document hash values on blockchain
On August 28, 2025, the U.S. Bureau of Economic Analysis announced that the annual growth rate of real GDP in the second quarter of 2025 would be revised to 3.3%.
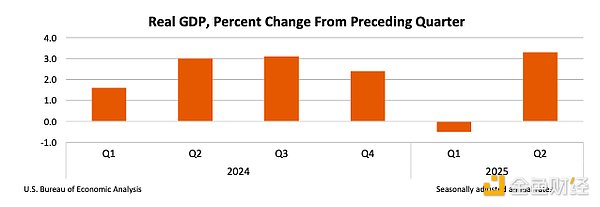
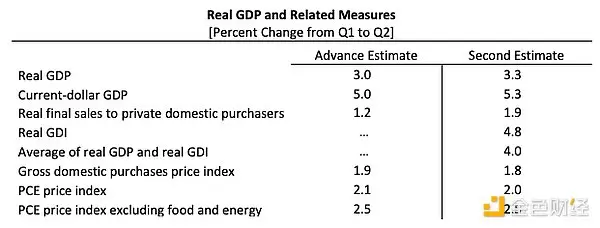
In addition to real GDP data, the U.S. Bureau of Economic Analysis also releases nominal GDP, real final sales by private domestic buyers, real gross domestic income (GDI), the average of real GDP and real GDI, the domestic purchases price index, the personal consumption expenditures (PCE) price index, and the core PCE price index.
The document is published in PDF format: https://www.bea.gov/sites/default/files/2025-08/gdp2q25-2nd.pdf
The U.S. Department of Commerce subsequently announced that it had published the official hash of the PDF file of GDP data for the second quarter of 2025 (including the total GDP in some cases) to the following nine blockchains: Bitcoin, Ethereum, Solana, TRON, Stellar, Avalanche, Arbitrum One, Polygon PoS and Optimism.
In other words, the U.S. Department of Commerce downloaded the above PDF file and performed a SHA256 hash operation on it, and the hash result was:
c70972a12908b73c2407d9cc6842ba2a02203a690f3090cd29f30c45f0cfd93d
This hash value is then published to nine blockchains, either as a memo or as data embedded in a smart contract, along with the total data (depending on the blockchain).
The transaction hash or smart contract address for each blockchain is as follows:
Bitcoin transaction hash:
fcf172401ca9d89013f13f5bbf0fc7577cb8a3588bf5cbc3b458ff36635fec00
Ethereum smart contract address:
0x36ccdF11044f60F196e981970d592a7DE567ed7b
Solana Transaction Hash:
43dJVBK4hiXy1rpC5BifT8LU2NDNHKmdWyqyYDaTfyEeX8y3LMtUtajW3Q22rCSbmneny56CBtkictQRQJXV1ybp
TRON transaction hash:
3f05633fb894aa6d6610c980975cca732a051edbbf5d8667799782cf2ae04040
Stellar transaction hash:
89e4d300d237db6b67c 510f71c8cd2f690868806a6b40a40a5a9755f4954144a
Avalanche smart contract address: 0x36ccdF11044f60F196e981970d592a7DE567ed7b
Arbitrum One smart contract address: 0x36ccdF11044f60F196e981970d592a7DE567ed7b
Polygon PoS smart contract address: 0x36ccdF11044f60F196e981970d592a7DE567ed7b
Optimism smart contract address: 0x36ccdF11044f60F196e981970d592a7DE567ed7b
Let’s open the Ethereum smart contract address and take a look:
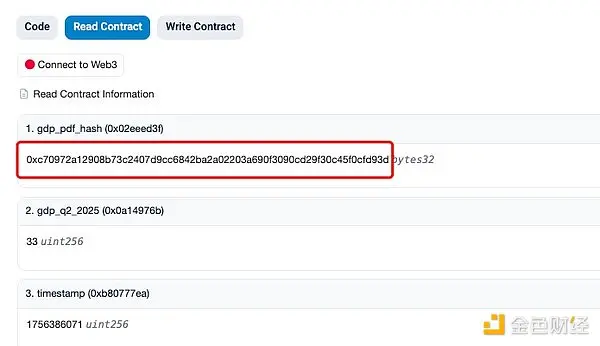
As shown above, the hash value of the U.S. Bureau of Economic Analysis GDP PDF file is indeed written into the Ethereum smart contract.
So what about Chainlink?
Feed: Chainlink brings 6 data feeds to the chain
Unlike the U.S. Department of Commerce, which simply uploads the hash value of PDF files to the chain, Chainlink feeds six key U.S. economic data as data sources (Data Feed) to 10 blockchains.
These six data are: real GDP, annualized growth rate of real GDP, PCE price index, annualized growth rate of PCE price index, actual final sales to private domestic buyers, and annualized growth rate of actual final sales to private domestic buyers.
Chainlink initially supports 10 blockchains: Arbitrum, Avalanche, Base, Botanix, Ethereum, Linea, Mantle, Optimism, Sonic, and ZKsync. Chainlink also stated that it will update the system monthly or quarterly, depending on the situation, and will gradually support more blockchain networks based on user demand.
Taking Ethereum as an example, its feed address is as follows:
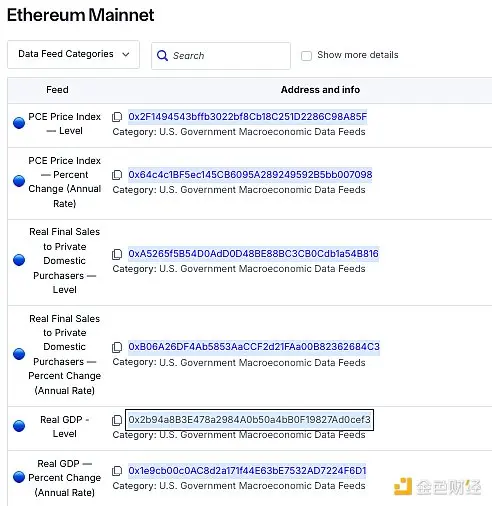
This means that as long as you integrate Chainlink and choose to read the US Government Macroeconomic Data Feeds, Chainlink will push these six economic indicator data of the US real economy to you on the chain.
Conclusion
Unlike the U.S. Department of Commerce, which merely uploads document hashes, Chainlink may be more significant.
Because oracles feed government macroeconomic data, they can unlock innovative use cases for the crypto market, such as serving as a data source for predicting market results, issuing crypto assets related to official data, inflation-linked crypto products, and so on.
This time, the U.S. Department of Commerce and Chainlink put some U.S. official data on the chain, which is of course a manifestation of the government's further acceptance of blockchain.
However, it's also important to note that many in the crypto industry already know that blockchain only guarantees that data on the chain cannot be tampered with, but the reliability of the uploaded data itself is questionable. Furthermore, some US government data has been subject to market skepticism, including from Trump himself.
Just as, the GDP data released by the U.S. Bureau of Economic Analysis this time is its second estimate.
The U.S. Bureau of Economic Analysis releases multiple revisions to its quarterly GDP figures to provide a more accurate picture of the economy. The Advance Estimate is the first release, typically about a month after the end of the period. The Second Estimate, released about a month after the first, is revised based on more data and offers a more accurate picture of the economy. The Third Estimate (Final Estimate) is the final estimate, based on more comprehensive data.
You May Also Like

Over 60% of crypto press releases linked to high-risk or scam projects: Report

ArtGis Finance Partners with MetaXR to Expand its DeFi Offerings in the Metaverse
