

Bitcoin (BTC) Price: Whale Sells 24,000 BTC Triggering Drop Below $109,000
TLDR
- Bitcoin dropped below $109,000 after a whale sold 24,000 BTC worth $2.7 billion
- Total crypto market capitalization fell to $3.84 trillion, with $205 billion exiting in 24 hours
- Nearly $930 million in leveraged positions were liquidated, affecting 205,000 traders
- BTC fell below the average cost basis ($110,800) of recent investors
- Key support level remains at $105,000 before potential deeper correction
Bitcoin has experienced a sharp price decline, dropping below $109,000 in early Asian trading on Tuesday. This marks a seven-week low for the leading cryptocurrency as market-wide selling pressure intensified.
The immediate catalyst for the price drop was a single Bitcoin whale offloading an entire batch of 24,000 BTC. This sale, worth approximately $2.7 billion, triggered a cascade of selling that saw Bitcoin’s price plummet by $4,000 in the hours that followed.
The broader cryptocurrency market has not been spared. Around $205 billion has exited crypto markets over the past 24 hours, bringing the total market capitalization down to $3.84 trillion. This represents the lowest level since August 6, though it remains within a six-week sideways channel despite the massive sell-off.
According to data from CoinGlass, approximately 205,000 traders were liquidated during this market correction. Total liquidations exceeded $930 million as leveraged long Bitcoin positions were flushed out of the market.
Some analysts have suggested that exchanges were actively dumping crypto assets to force these liquidations of long positions. The event marks one of the largest Bitcoin long liquidation events since December 2024, with over $150 million in longs wiped out.
Technical Analysis Points to Further Weakness
Glassnode data reveals that Bitcoin has now dropped below the average cost basis ($110,800) of investors who accumulated during the May to July rally. These holders typically purchased their coins one to three months ago.
“Historically, failure to hold above this level has often led to multi-month market weakness and potential deeper corrections,” Glassnode noted.
The current Bitcoin correction stands at approximately 12%. While painful for recent buyers, this pullback remains shallower than those seen in previous bull market years. For comparison, Bitcoin retreated by 36% in September 2017 and 24% in September 2021.
Market analysts suggest that a retreat between these historical levels could potentially see Bitcoin prices back at $87,000 before the bull market resumes its course.
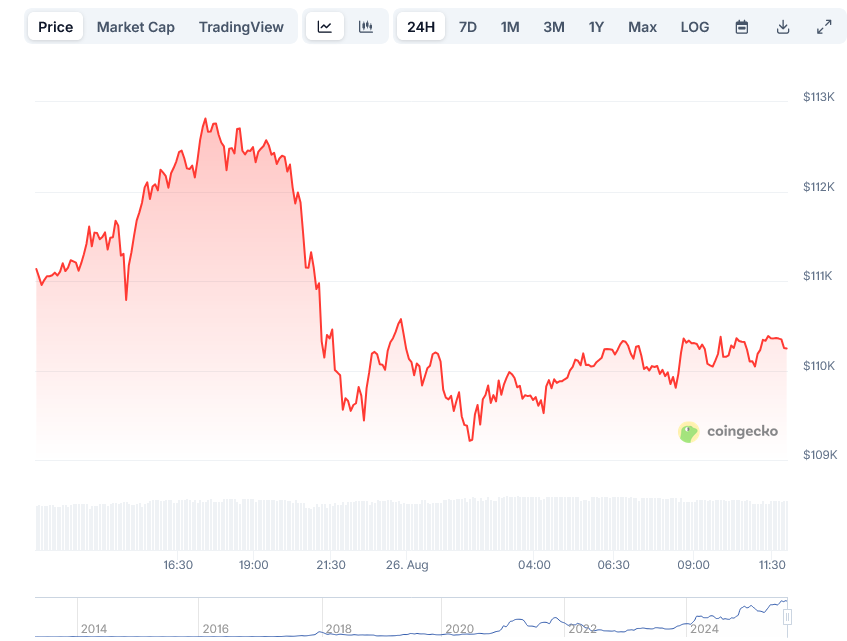 Bitcoin Price on CoinGecko
Altcoins Feel the Pain
As is often the case during Bitcoin corrections, alternative cryptocurrencies have suffered even more severe losses.
Solana dropped over 11% to $186, while Dogecoin fell 10% to $0.21. Cardano slid 9% to $0.83, and Chainlink tanked 11% to $23.30.
Other altcoins experiencing pain include Hyperliquid, Sui, Avalanche, and Litecoin. Ethereum lost 7% on the day but remained within its sideways channel. At the time of writing, ETH had started to recover, trading above $4,400. However, ETH has still lost over 11% since reaching its all-time high just two days ago.
The synchronized selling behavior across all wallet sizes highlights uniform sell-side pressure, weighing on Bitcoin’s price stability. Analysis shows that smaller holders (0-1 BTC) have steadily accumulated since the peak, while mid-sized wallets (1-10 BTC) resumed buying below $107,000.
By contrast, larger wallets holding 10-100 BTC flipped to net sellers after Bitcoin reached $118,000. The very largest holders with over 1,000 BTC continue to distribute their holdings consistently.
The 100-1,000 BTC holder group appears split between accumulation and distribution around the $105,000 level. This makes $105,000 a key support zone and possibly the last stronghold before more serious corrections could occur.
Market analysis suggests that if Bitcoin loses the $105,000 support level, the lack of dense cost support between current levels and $90,000 could accelerate downside momentum.
The current pullback aligns with Bitcoin’s seasonal tendencies. Historically, August to September has marked a period of weakness in cryptocurrency markets. Since 2017, Bitcoin has posted an average decline of 21.7% during Asia’s “ghost month,” which runs this year from August 23 to September 21.
Based on historical averages, a retreat toward the $105,000-$100,000 range remains consistent with seasonal patterns and technical support zones.
Some traders have noted that Bitcoin’s recent rally may be more closely tied to a weakening US dollar than organic demand. They warn that enthusiasm following the launch of spot Bitcoin ETFs may be fading, with higher-timeframe charts showing exhaustion patterns that resemble past distribution phases.
Bitcoin traded at $110,205 at the time of writing.
The post Bitcoin (BTC) Price: Whale Sells 24,000 BTC Triggering Drop Below $109,000 appeared first on Blockonomi.
You May Also Like

Top Altcoins To Hold Before 2026 For Maximum ROI – One Is Under $1!

UBS CEO Targets Direct Crypto Access With “Fast Follower” Tokenization Strategy
