The post Sui Price Struggles at $3.4, Is a 10% Correction Coming? appeared first on Coinpedia Fintech News Sui price is facing pressure after a sharp pullback, with a value of $3.40, down 3.91% in the past 24 hours. Its market cap stands at $11.94 billion, while 24-hour trading volume has fallen 10.5% to $1.62 billion. The token is now more than 36% below its ATH of $5.35, as traders weigh weakening technical …The post Sui Price Struggles at $3.4, Is a 10% Correction Coming? appeared first on Coinpedia Fintech News Sui price is facing pressure after a sharp pullback, with a value of $3.40, down 3.91% in the past 24 hours. Its market cap stands at $11.94 billion, while 24-hour trading volume has fallen 10.5% to $1.62 billion. The token is now more than 36% below its ATH of $5.35, as traders weigh weakening technical …

Sui Price Struggles at $3.4, Is a 10% Correction Coming?

2 min read
Sui Price Analysis

The post Sui Price Struggles at $3.4, Is a 10% Correction Coming? appeared first on Coinpedia Fintech News

Sui price is facing pressure after a sharp pullback, with a value of $3.40, down 3.91% in the past 24 hours. Its market cap stands at $11.94 billion, while 24-hour trading volume has fallen 10.5% to $1.62 billion. The token is now more than 36% below its ATH of $5.35, as traders weigh weakening technical momentum and softening ecosystem data.

What Does the On-chain Say?

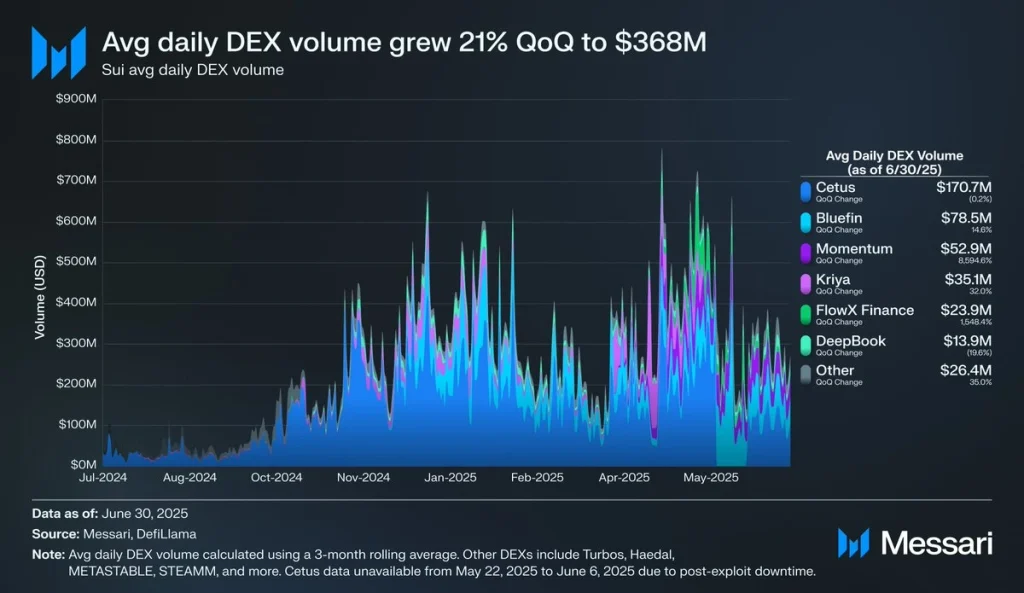
Sui’s on-chain performance has cooled in recent weeks. According to Messari, average daily DEX volume on Sui grew 21% quarter-on-quarter to $368M, but growth was uneven. While platforms like Momentum is up 8,594% and FlowX Finance is up 1,548%. Cetus, the largest DEX was flat at $170.7M, signaling consolidation at the top.

SUI Avg DEX Volume

Meanwhile, the TVL dropped 11% to $3.4B in the past week, reflecting reduced user engagement. On the derivatives side, SUI futures open interest plunged 31% from $2.66B in late July to $1.84B. And long liquidations totaled $5.64M on August 20, hinting at shaken trader confidence.

Sui Price Analysis:

Technically speaking, SUI is under pressure after breaking below its 50-day moving average at $3.69 and pivot point at $3.46. Moreover, the MACD histogram at -0.0293 confirms persistent bearish momentum.

Sui Price Analysis 26-8-25

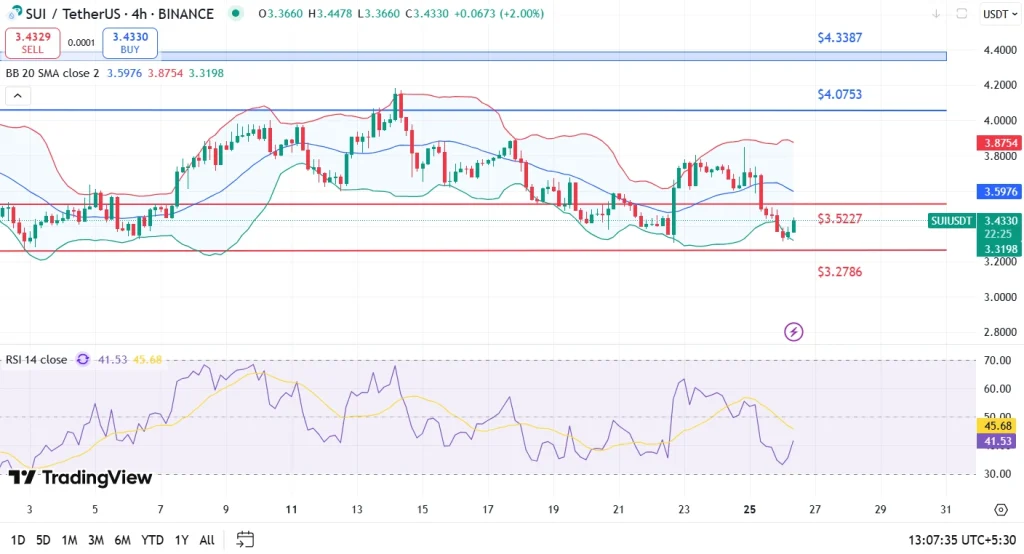
Successively, the immediate support for the Sui price sits near $3.32, with a more crucial level at $3.27. A daily close below $3.27 could open the door to a further 10–15% decline, targeting the $2.90–$3.00 range.

On the upside, resistance lies at $3.52, followed by $3.69 and $4.07. The RSI near 41 suggests SUI is approaching oversold territory, but buyers are yet to stage a convincing defense.

FAQs

Why is SUI price down today?

SUI slipped below key technical levels amid falling TVL, reduced futures open interest, and heavy long liquidations.

What key levels should I watch for Sui?

Support is at $3.32 and $3.27. Resistance sits at $3.52, then $3.69 and $4.07.

Could SUI rebound soon?

While RSI shows oversold conditions, a rebound needs a sustained close above $3.52 to confirm strength.

Market Opportunity
SUI Logo
SUI Price(SUI)
--
----
USD
SUI (SUI) Live Price Chart
Disclaimer: The articles reposted on this site are sourced from public platforms and are provided for informational purposes only. They do not necessarily reflect the views of MEXC. All rights remain with the original authors. If you believe any content infringes on third-party rights, please contact service@support.mexc.com for removal. MEXC makes no guarantees regarding the accuracy, completeness, or timeliness of the content and is not responsible for any actions taken based on the information provided. The content does not constitute financial, legal, or other professional advice, nor should it be considered a recommendation or endorsement by MEXC.

You May Also Like

Top Altcoins To Hold Before 2026 For Maximum ROI – One Is Under $1!

Top Altcoins To Hold Before 2026 For Maximum ROI – One Is Under $1!

BlockchainFX presale surges past $7.5M at $0.024 per token with 500x ROI potential, staking rewards, and BLOCK30 bonus still live — top altcoin to hold before 2026.
Share
Blockchainreporter2025/09/18 01:16
UBS CEO Targets Direct Crypto Access With “Fast Follower” Tokenization Strategy

UBS CEO Targets Direct Crypto Access With “Fast Follower” Tokenization Strategy

The tension in UBS’s latest strategy update is not between profit and innovation, but between speed and control. On February 4, 2026, as the bank reported a record
Share
Ethnews2026/02/05 04:56
Cryptos Signal Divergence Ahead of Fed Rate Decision

Cryptos Signal Divergence Ahead of Fed Rate Decision

The post Cryptos Signal Divergence Ahead of Fed Rate Decision appeared on BitcoinEthereumNews.com. Crypto assets send conflicting signals ahead of the Federal Reserve’s September rate decision. On-chain data reveals a clear decrease in Bitcoin and Ethereum flowing into centralized exchanges, but a sharp increase in altcoin inflows. The findings come from a Tuesday report by CryptoQuant, an on-chain data platform. The firm’s data shows a stark divergence in coin volume, which has been observed in movements onto centralized exchanges over the past few weeks. Bitcoin and Ethereum Inflows Drop to Multi-Month Lows Sponsored Sponsored Bitcoin has seen a dramatic drop in exchange inflows, with the 7-day moving average plummeting to 25,000 BTC, its lowest level in over a year. The average deposit per transaction has fallen to 0.57 BTC as of September. This suggests that smaller retail investors, rather than large-scale whales, are responsible for the recent cash-outs. Ethereum is showing a similar trend, with its daily exchange inflows decreasing to a two-month low. CryptoQuant reported that the 7-day moving average for ETH deposits on exchanges is around 783,000 ETH, the lowest in two months. Other Altcoins See Renewed Selling Pressure In contrast, other altcoin deposit activity on exchanges has surged. The number of altcoin deposit transactions on centralized exchanges was quite steady in May and June of this year, maintaining a 7-day moving average of about 20,000 to 30,000. Recently, however, that figure has jumped to 55,000 transactions. Altcoins: Exchange Inflow Transaction Count. Source: CryptoQuant CryptoQuant projects that altcoins, given their increased inflow activity, could face relatively higher selling pressure compared to BTC and ETH. Meanwhile, the balance of stablecoins on exchanges—a key indicator of potential buying pressure—has increased significantly. The report notes that the exchange USDT balance, around $273 million in April, grew to $379 million by August 31, marking a new yearly high. CryptoQuant interprets this surge as a reflection of…
Share
BitcoinEthereumNews2025/09/18 01:01