

Chainlink Loses Key Support as Price Stalls Below Broken Structure
Chainlink is trading at a structurally sensitive level as recent downside pressure continues to weigh on short-term price action.
As of January 28, LINK is changing hands around $11.9, following a sharp liquidation move earlier in the week that disrupted the prior consolidation range. While price has stabilized from the local low, the broader structure remains fragile, with LINK struggling to reclaim broken support.
This area matters because current trading is occurring below a previously established compression zone, shifting the market from balance into a reactive phase. The inability to recover key levels keeps downside risk active, even as volatility cools.
Short-term price action shows weak stabilization
On the 4-hour chart, LINK sold off aggressively from the $12.6–$12.8 region, accelerating lower into a sharp wick down toward the $11.4–$11.5 zone. That flush was accompanied by a noticeable spike in volume, consistent with liquidation-driven selling rather than orderly distribution.
Since that event, price has rebounded modestly and is now consolidating between roughly $11.8 and $12.0, but the recovery lacks follow-through. Each attempt to push higher has been capped quickly, producing a series of lower highs. Volume has also tapered off during the rebound, suggesting that buying interest remains cautious rather than assertive.
Immediate resistance is now clustered around $12.0–$12.2, a zone that previously acted as support before the breakdown. As long as price remains below this area, the short-term structure continues to favor continuation rather than reversal.
Higher-timeframe structure remains damaged
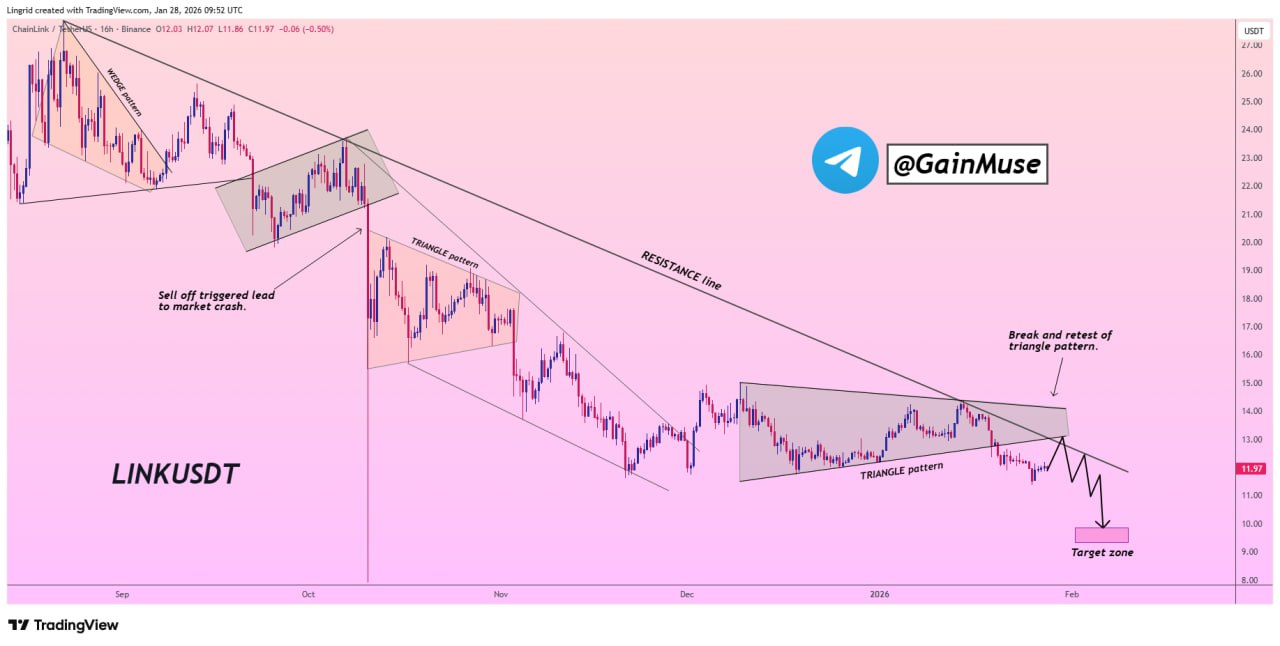
From a broader technical perspective, the breakdown aligns with the loss of a multi-week triangle structure highlighted by crypto trader GainMuse, who noted that LINK failed to hold the lower boundary of its compression range. The subsequent bounce resembles a weak retest, not a base formation, with price respecting descending resistance rather than reclaiming it.
 Source: https://t.me/gainmuse/1719
The repeated inability to regain the broken triangle keeps LINK structurally capped. Lower highs forming beneath resistance reinforce the idea that control has shifted away from buyers, and that recent stabilization is corrective rather than impulsive.
As long as LINK trades below the former triangle range, downside targets remain technically valid. Sustained acceptance below $12.0 keeps pressure tilted toward the prior low near $11.5, with risk of extension if that support fails to hold on a closing basis.
Scenarios and risk levels to watch
From here, two paths are structurally clear. A bullish stabilization case would require LINK to reclaim $12.2 with acceptance, invalidating the current lower-high sequence and signaling that the breakdown was a deviation rather than a trend shift. Without that reclaim, upside attempts remain vulnerable to rejection.
On the downside, failure to hold the $11.5 support zone would expose LINK to continuation toward the next marked target area visible on the chart, as the market would be confirming acceptance below prior demand. Until one of these levels resolves, price remains in a compression phase beneath resistance.
Conclusion
Chainlink is no longer in a neutral consolidation. While the immediate post-liquidation volatility has eased, the structural damage from the breakdown remains unresolved. Price is stabilizing, but stabilization alone is not confirmation.
For now, the market favors continuation risk while LINK trades below former support. Any shift in bias will depend on whether price can reclaim lost structure, rather than simply hold above local lows.
The post Chainlink Loses Key Support as Price Stalls Below Broken Structure appeared first on ETHNews.
You May Also Like

Pi Network Targets Open Mainnet 2026, Millions Prepare as Utility and Migration Accelerate

Bitcoin Rainbow chart predicts BTC price for October 1, 2025
