Stocks slid from record levels as Trump's latest threats against the EU add to trade uncertainty.Stocks slid from record levels as Trump's latest threats against the EU add to trade uncertainty.

Dow Jones down 200 points amid tariff threats, Fed uncertainty

2 min read

Major U.S. stock indices hovered near record levels as markets assessed the latest attacks on the Fed Chair

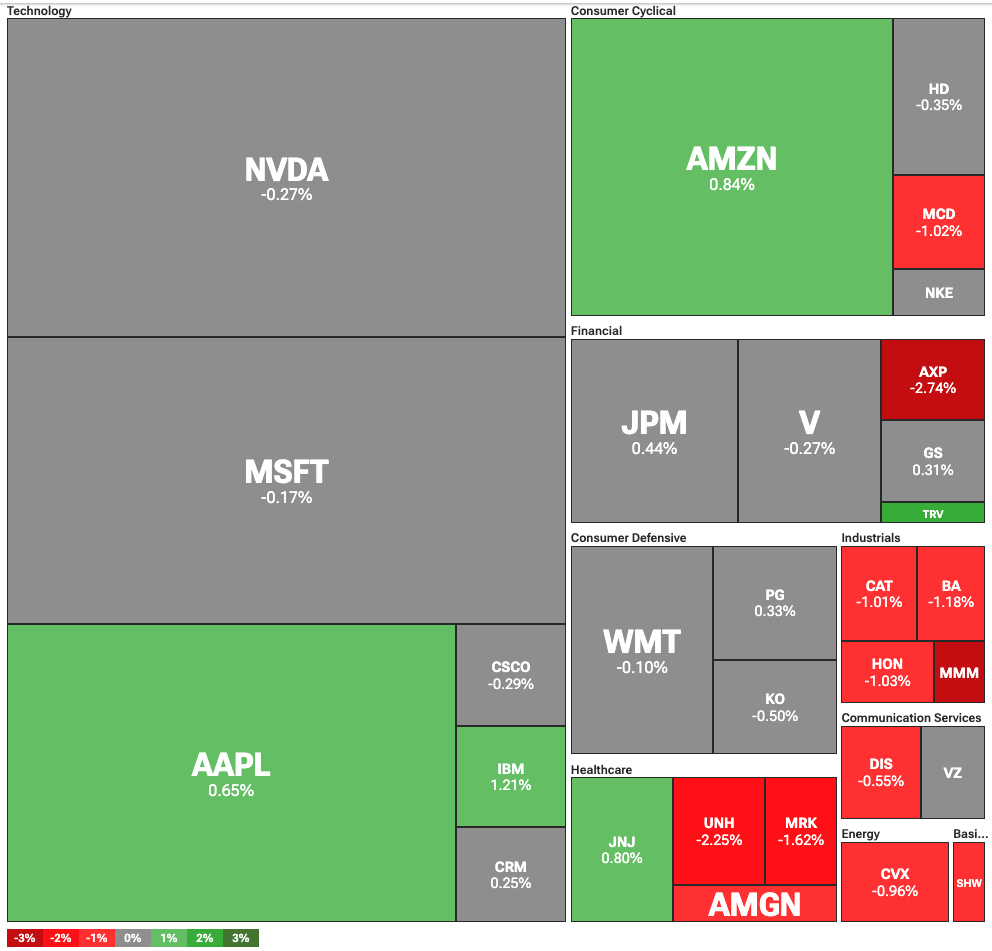
U.S. stocks hovered near record levels amid ongoing uncertainty over the Fed and tariffs. On Friday, Dow Jones fell 238 points or 0.54%, and the S&P 500 fell 0.14%. At the same time, the tech-focused Nasdaq Composite fell 0.09%.

The much-anticipated Netflix earnings did not deliver the news that traders were hoping for. The stock fell 5% despite beating earnings forecasts, as the company issued a lower-than-expected guidance. At the same time, shares of American Express were also down 2.5% despite strong earnings.

Dow Jones Industrial Average heatmap

Traders were focused on the latest tariffs against the EU and the ongoing feud between the Fed Chair Jerome Powell and President Donald Trump. For one, Trump escalated his demands against the EU, pushing the 15% minimum tariff on imports to 20%.

This escalation came after weeks of negotiations that seemed to establish a 10% baseline tariff on most goods. What is more, Trump rebuked the EU’s offer to reduce its tariffs on U.S. automobiles, and suggested that the rate could stay at 25%.

Trump continues attacks against the Fed Chair

Trump has also continued his attacks against the Fed Chair Jerome Powell, calling him a “numbskull” for not lowering interest rates. The President stated that higher interest rates are making it more difficult for young people to buy houses.

Trump also said that Powell was “truly one of my worst appointments,” before placing a part of the blame on Joe Biden, who reappointed him. The attacks come after ongoing criticism over the $2.5 billion renovation of several Fed buildings.

Several Trump appointees criticized the Chair over the renovation, setting the stage for a potential coup. However, recent reports suggest that Trump appointees pushed for the use of expensive marble in the buildings, which added to the costs.

Market Opportunity
OFFICIAL TRUMP Logo
OFFICIAL TRUMP Price(TRUMP)
$4.153
$4.153$4.153
+0.26%
USD
OFFICIAL TRUMP (TRUMP) Live Price Chart
Disclaimer: The articles reposted on this site are sourced from public platforms and are provided for informational purposes only. They do not necessarily reflect the views of MEXC. All rights remain with the original authors. If you believe any content infringes on third-party rights, please contact service@support.mexc.com for removal. MEXC makes no guarantees regarding the accuracy, completeness, or timeliness of the content and is not responsible for any actions taken based on the information provided. The content does not constitute financial, legal, or other professional advice, nor should it be considered a recommendation or endorsement by MEXC.
Tags:

You May Also Like

Top Altcoins To Hold Before 2026 For Maximum ROI – One Is Under $1!

Top Altcoins To Hold Before 2026 For Maximum ROI – One Is Under $1!

BlockchainFX presale surges past $7.5M at $0.024 per token with 500x ROI potential, staking rewards, and BLOCK30 bonus still live — top altcoin to hold before 2026.
Share
Blockchainreporter2025/09/18 01:16
UBS CEO Targets Direct Crypto Access With “Fast Follower” Tokenization Strategy

UBS CEO Targets Direct Crypto Access With “Fast Follower” Tokenization Strategy

The tension in UBS’s latest strategy update is not between profit and innovation, but between speed and control. On February 4, 2026, as the bank reported a record
Share
Ethnews2026/02/05 04:56
Cryptos Signal Divergence Ahead of Fed Rate Decision

Cryptos Signal Divergence Ahead of Fed Rate Decision

The post Cryptos Signal Divergence Ahead of Fed Rate Decision appeared on BitcoinEthereumNews.com. Crypto assets send conflicting signals ahead of the Federal Reserve’s September rate decision. On-chain data reveals a clear decrease in Bitcoin and Ethereum flowing into centralized exchanges, but a sharp increase in altcoin inflows. The findings come from a Tuesday report by CryptoQuant, an on-chain data platform. The firm’s data shows a stark divergence in coin volume, which has been observed in movements onto centralized exchanges over the past few weeks. Bitcoin and Ethereum Inflows Drop to Multi-Month Lows Sponsored Sponsored Bitcoin has seen a dramatic drop in exchange inflows, with the 7-day moving average plummeting to 25,000 BTC, its lowest level in over a year. The average deposit per transaction has fallen to 0.57 BTC as of September. This suggests that smaller retail investors, rather than large-scale whales, are responsible for the recent cash-outs. Ethereum is showing a similar trend, with its daily exchange inflows decreasing to a two-month low. CryptoQuant reported that the 7-day moving average for ETH deposits on exchanges is around 783,000 ETH, the lowest in two months. Other Altcoins See Renewed Selling Pressure In contrast, other altcoin deposit activity on exchanges has surged. The number of altcoin deposit transactions on centralized exchanges was quite steady in May and June of this year, maintaining a 7-day moving average of about 20,000 to 30,000. Recently, however, that figure has jumped to 55,000 transactions. Altcoins: Exchange Inflow Transaction Count. Source: CryptoQuant CryptoQuant projects that altcoins, given their increased inflow activity, could face relatively higher selling pressure compared to BTC and ETH. Meanwhile, the balance of stablecoins on exchanges—a key indicator of potential buying pressure—has increased significantly. The report notes that the exchange USDT balance, around $273 million in April, grew to $379 million by August 31, marking a new yearly high. CryptoQuant interprets this surge as a reflection of…
Share
BitcoinEthereumNews2025/09/18 01:01