Bitcoin has closed the CME futures gap near $94,800, a technical milestone that analysts view as a bullish signal. CME gaps form when Bitcoin’s weekend [...]Bitcoin has closed the CME futures gap near $94,800, a technical milestone that analysts view as a bullish signal. CME gaps form when Bitcoin’s weekend [...]

Will Ethereum Continue Its Bullish Streak As Tom Lee’s BitMine Adds $65M In ETH?

3 min read

Ethereum has shown signs of renewed momentum, climbing 6.7% over the past week and briefly reclaiming the $3,400 level on Wednesday, January 14. As of early January 17 (around 2:30 a.m. EST), the price has pulled back slightly to $3,291, with 24-hour trading volume dropping 21% to $20.5 billion suggesting a quieter day of activity amid consolidation.

This recent uptick comes against a backdrop of sustained institutional interest in the asset, which could help fuel further gains in the near term.

Ethereum Sees Significant Institutional, ETF Inflows

Ethereum continues to attract strong interest from institutional investors, with spot Ethereum exchange-traded funds (ETFs) seeing nearly $500 million in inflows in the last week, according to Coinglass data.

Wednesday alone brought in $175.1 million, marking the biggest single-day ETF inflow of 2026 and the highest since December 2025.

While weekly and daily trading volumes take a plunge, some firms, like Bitmine, led by Wall Street Strategist Tom Lee, are still adding ETH to their holdings. 

The most recent purchase by Bitmine was $65 million worth of Ethereum, which highlights growing institutional confidence in the cryptocurrency.

This move by Tom Lee’s crypto infrastructure firm underscores Ethereum’s growing appeal beyond its smart contract capabilities, as it gains traction across DeFi, NFTs, and tokenized assets.

Moreover, the acquisition reflects a broader trend of institutional interest in the king of altcoins, which is seen as a versatile asset with potential for scalability improvements and future demand from a possible spot ETH ETF.

Such institutional activity could bolster Ethereum’s price stability, especially in volatile market conditions.

Will Ethereum Surge Again From Here?

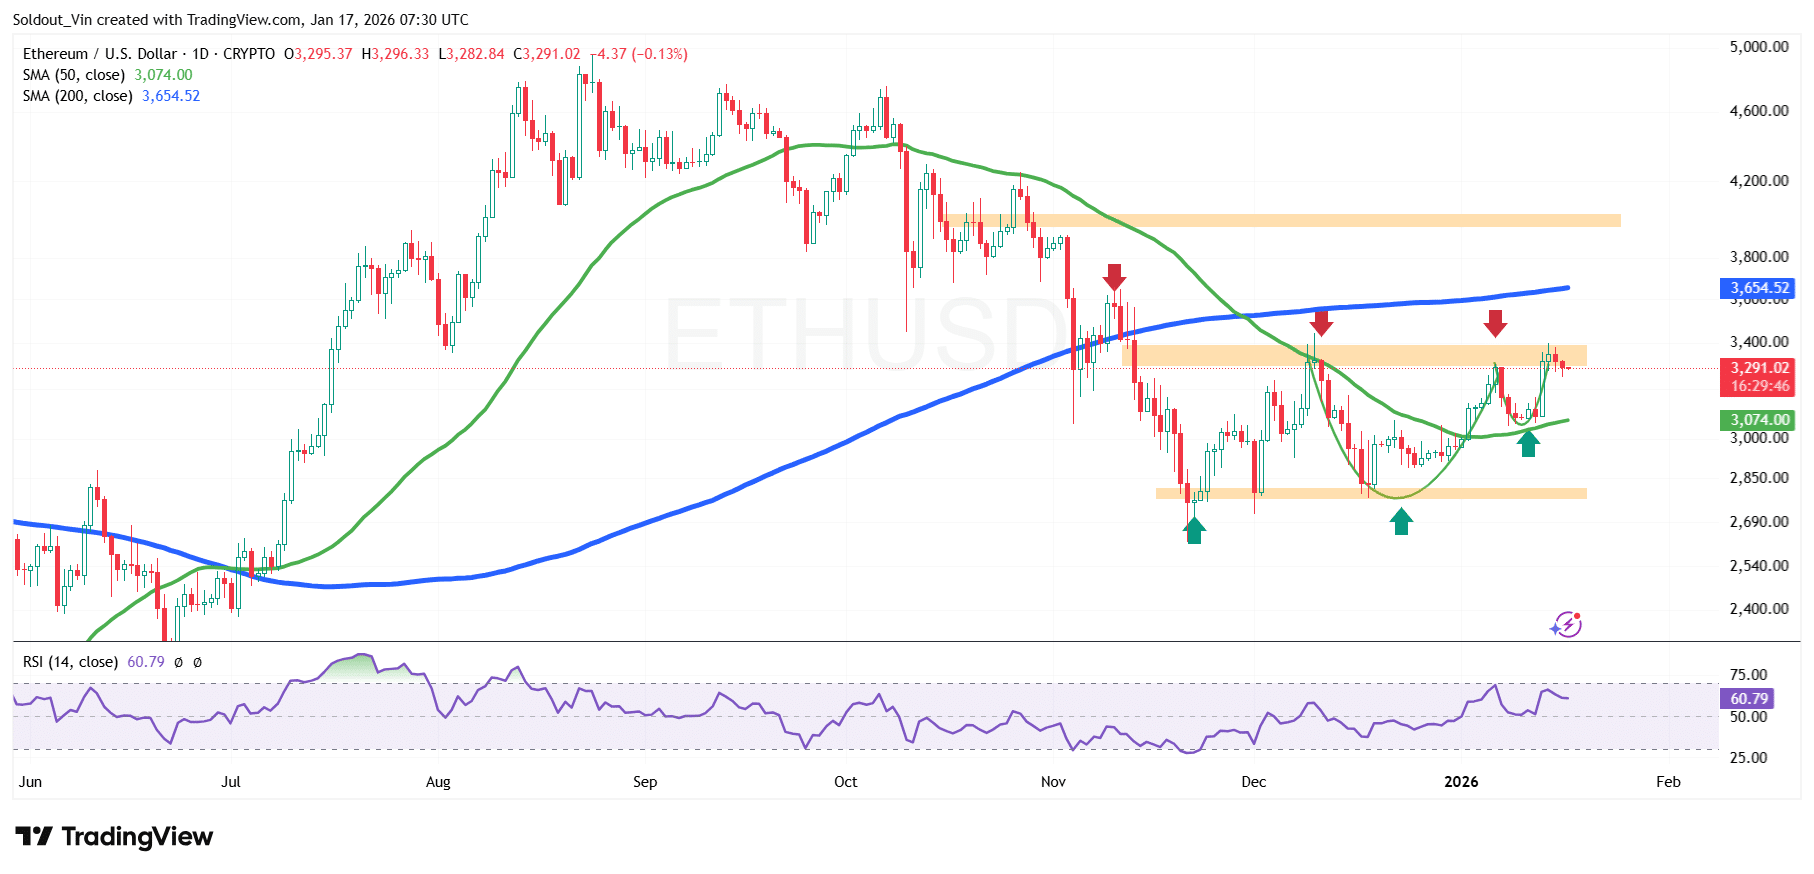
Ethereum price is currently consolidating above the $3,070 support zone, which aligns closely with the 50-day Simple Moving Average (SMA). The recent rebound from the $2,750–$2,850 demand area indicates that buyers are actively defending this region, forming a higher low on the daily chart.

As a result, ETH has successfully reclaimed the 50-day SMA at $3,074, which supports a short-term bullish outlook. However, the 200-day SMA at $3,654 remains a key overhead resistance. Multiple rejections near this level suggest that sellers are still active, making it a critical barrier for trend continuation.

Ethereum’s Relative Strength Index (RSI) is currently around 60.79, which is above the neutral 50 level but below overbought conditions. This indicates that bullish momentum is building while still leaving room for further upside before the market becomes overheated.

At the same time, the price structure shows a rounded bottom formation and improving momentum, signaling a potential trend transition phase rather than a confirmed breakout.

ETH/USD Chart Analysis: TradingViewETH/USD Chart Analysis: TradingView

The 1-day ETH/USD chart analysis suggests that Ethereum could attempt a move toward the $3,350–$3,450 resistance zone, which previously acted as support. A daily close above this area could open the door for a retest of the 200-day SMA near $3,650, marking the next major upside target.

On the downside, if the price of ETH fails to hold above the 50-day SMA, short-term profit-taking could push the price back toward the $2,850 support zone, where buyers have previously stepped.

Overall, Ethereum is showing early signs of recovery, but a confirmed bullish continuation will require a clean break and acceptance above the 200-day SMA.

Market Opportunity
Bullish Degen Logo
Bullish Degen Price(BULLISH)
$0.00705
$0.00705$0.00705
-2.58%
USD
Bullish Degen (BULLISH) Live Price Chart
Disclaimer: The articles reposted on this site are sourced from public platforms and are provided for informational purposes only. They do not necessarily reflect the views of MEXC. All rights remain with the original authors. If you believe any content infringes on third-party rights, please contact service@support.mexc.com for removal. MEXC makes no guarantees regarding the accuracy, completeness, or timeliness of the content and is not responsible for any actions taken based on the information provided. The content does not constitute financial, legal, or other professional advice, nor should it be considered a recommendation or endorsement by MEXC.

You May Also Like

Top Altcoins To Hold Before 2026 For Maximum ROI – One Is Under $1!

Top Altcoins To Hold Before 2026 For Maximum ROI – One Is Under $1!

BlockchainFX presale surges past $7.5M at $0.024 per token with 500x ROI potential, staking rewards, and BLOCK30 bonus still live — top altcoin to hold before 2026.
Share
Blockchainreporter2025/09/18 01:16
UBS CEO Targets Direct Crypto Access With “Fast Follower” Tokenization Strategy

UBS CEO Targets Direct Crypto Access With “Fast Follower” Tokenization Strategy

The tension in UBS’s latest strategy update is not between profit and innovation, but between speed and control. On February 4, 2026, as the bank reported a record
Share
Ethnews2026/02/05 04:56
Cryptos Signal Divergence Ahead of Fed Rate Decision

Cryptos Signal Divergence Ahead of Fed Rate Decision

The post Cryptos Signal Divergence Ahead of Fed Rate Decision appeared on BitcoinEthereumNews.com. Crypto assets send conflicting signals ahead of the Federal Reserve’s September rate decision. On-chain data reveals a clear decrease in Bitcoin and Ethereum flowing into centralized exchanges, but a sharp increase in altcoin inflows. The findings come from a Tuesday report by CryptoQuant, an on-chain data platform. The firm’s data shows a stark divergence in coin volume, which has been observed in movements onto centralized exchanges over the past few weeks. Bitcoin and Ethereum Inflows Drop to Multi-Month Lows Sponsored Sponsored Bitcoin has seen a dramatic drop in exchange inflows, with the 7-day moving average plummeting to 25,000 BTC, its lowest level in over a year. The average deposit per transaction has fallen to 0.57 BTC as of September. This suggests that smaller retail investors, rather than large-scale whales, are responsible for the recent cash-outs. Ethereum is showing a similar trend, with its daily exchange inflows decreasing to a two-month low. CryptoQuant reported that the 7-day moving average for ETH deposits on exchanges is around 783,000 ETH, the lowest in two months. Other Altcoins See Renewed Selling Pressure In contrast, other altcoin deposit activity on exchanges has surged. The number of altcoin deposit transactions on centralized exchanges was quite steady in May and June of this year, maintaining a 7-day moving average of about 20,000 to 30,000. Recently, however, that figure has jumped to 55,000 transactions. Altcoins: Exchange Inflow Transaction Count. Source: CryptoQuant CryptoQuant projects that altcoins, given their increased inflow activity, could face relatively higher selling pressure compared to BTC and ETH. Meanwhile, the balance of stablecoins on exchanges—a key indicator of potential buying pressure—has increased significantly. The report notes that the exchange USDT balance, around $273 million in April, grew to $379 million by August 31, marking a new yearly high. CryptoQuant interprets this surge as a reflection of…
Share
BitcoinEthereumNews2025/09/18 01:01