

Bitcoin Fills $94,800 CME Gap, Eyes $100K Rally
Bitcoin has closed the CME futures gap near $94,800, a technical milestone that analysts view as a bullish signal.
CME gaps form when Bitcoin’s weekend price movements on 24/7 spot markets create unfilled price ranges on the CME futures chart, which does not trade over weekends.
Historically, if these gaps act as focal points for technical traders, they tend to be revisited and filled by subsequent price action.
Based on the BTC CME futures chart, the gap near $94,800 has now been filled, a condition for further upside. Therefore, a weekly close above the $94,000 level may open the door for BTC to extend its rally toward the $100,000 threshold.
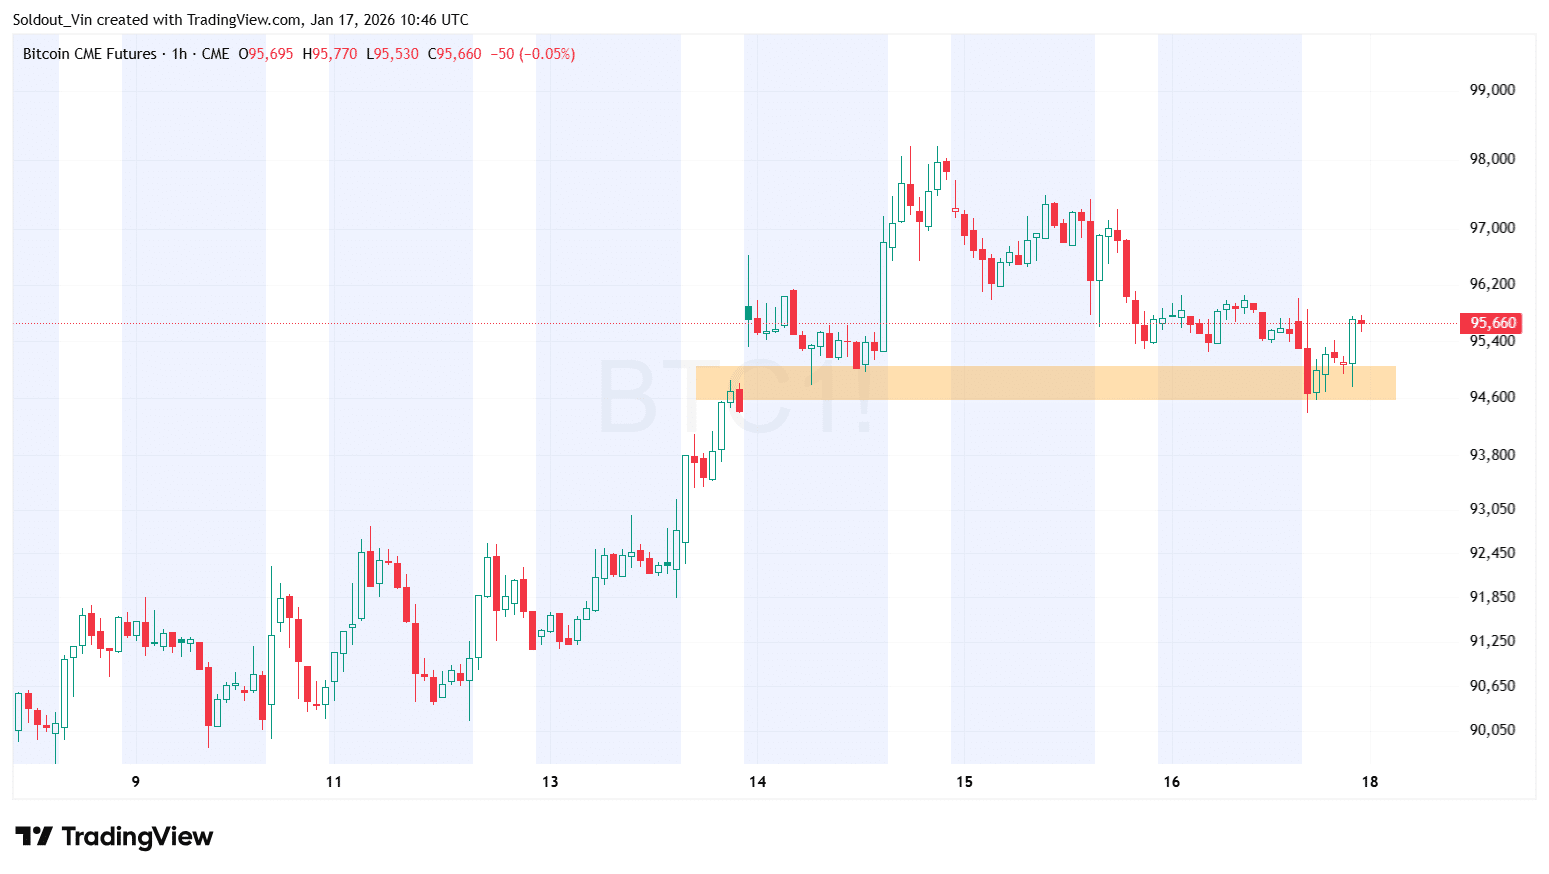 BTCCME Futures: TradingView
The CME gap is a significant level amid recent price resilience above $90,000, where bulls have defended support areas before staging rebounds. BTC dropped to below $94,000 and has since moved toward $95,000, filling the gap.
Bitcoin Heads for Weekly Gain After Muted New Year
Bitcoin is up 5% this week, as it also benefited from some bargain buying after a muted start of the new year.
A bulk of the coin’s gains this week came after top corporate holder, Strategy, disclosed a purchase of over $1 billion worth of BTC, drumming up some hopes over improving corporate demand for the King of crypto.
However, retail demand remained under pressure, as broader sentiment towards the crypto space remained skittish. The Bitcoin price continued to trade at a discount, indicating that retail sentiment remained weak.
This comes as US lawmakers earlier this week delayed a key discussion on a planned crypto regulatory framework, after Coinbase opposed the bill in its current version.
BTC is now down just a fraction of a percentage to trade at $95,100 as of 6:26 a.m. EST, according to Coingecko data.
Related News:
You May Also Like

Top Altcoins To Hold Before 2026 For Maximum ROI – One Is Under $1!

UBS CEO Targets Direct Crypto Access With “Fast Follower” Tokenization Strategy
