WLFI price is forming a bullish Three Drives pattern at the $0.12 support zone, with rising volume signalling a potential reversal toward higher resistance levels.WLFI price is forming a bullish Three Drives pattern at the $0.12 support zone, with rising volume signalling a potential reversal toward higher resistance levels.

WLFI price forms bullish Three Drives with rising volume: Reversal forming?

3 min read

WLFI price is forming a bullish Three Drives pattern at the $0.12 support zone, with rising volume signalling a potential reversal toward higher resistance levels.

Summary
  • Buyers consistently defend the $0.12 support zone
  • Rising volume signals strengthening demand
  • Structure hints at a potential reversal toward $0.18

World Liberty Financial (WLFI), the DeFi venture closely tied to President Donald Trump and his family, is showing early signs of a bullish reversal, with price action forming a Three Drives pattern at the $0.12 support level.

This level has held firm across multiple retests, demonstrating consistent buyer interest and suggesting that demand remains active.

With volume increasing and structural support intact, WLFI may be preparing for its next move upward within the current trading range.

WLFI price key technical points

  • WLFI forms a bullish Three Drives pattern at the $0.12 support
  • Multiple retests confirm demand at this key level
  • Rising volume supports the probability of a reversal toward $0.18
WLFI price forms bullish Three Drives with rising volume: Reversal forming? - 1

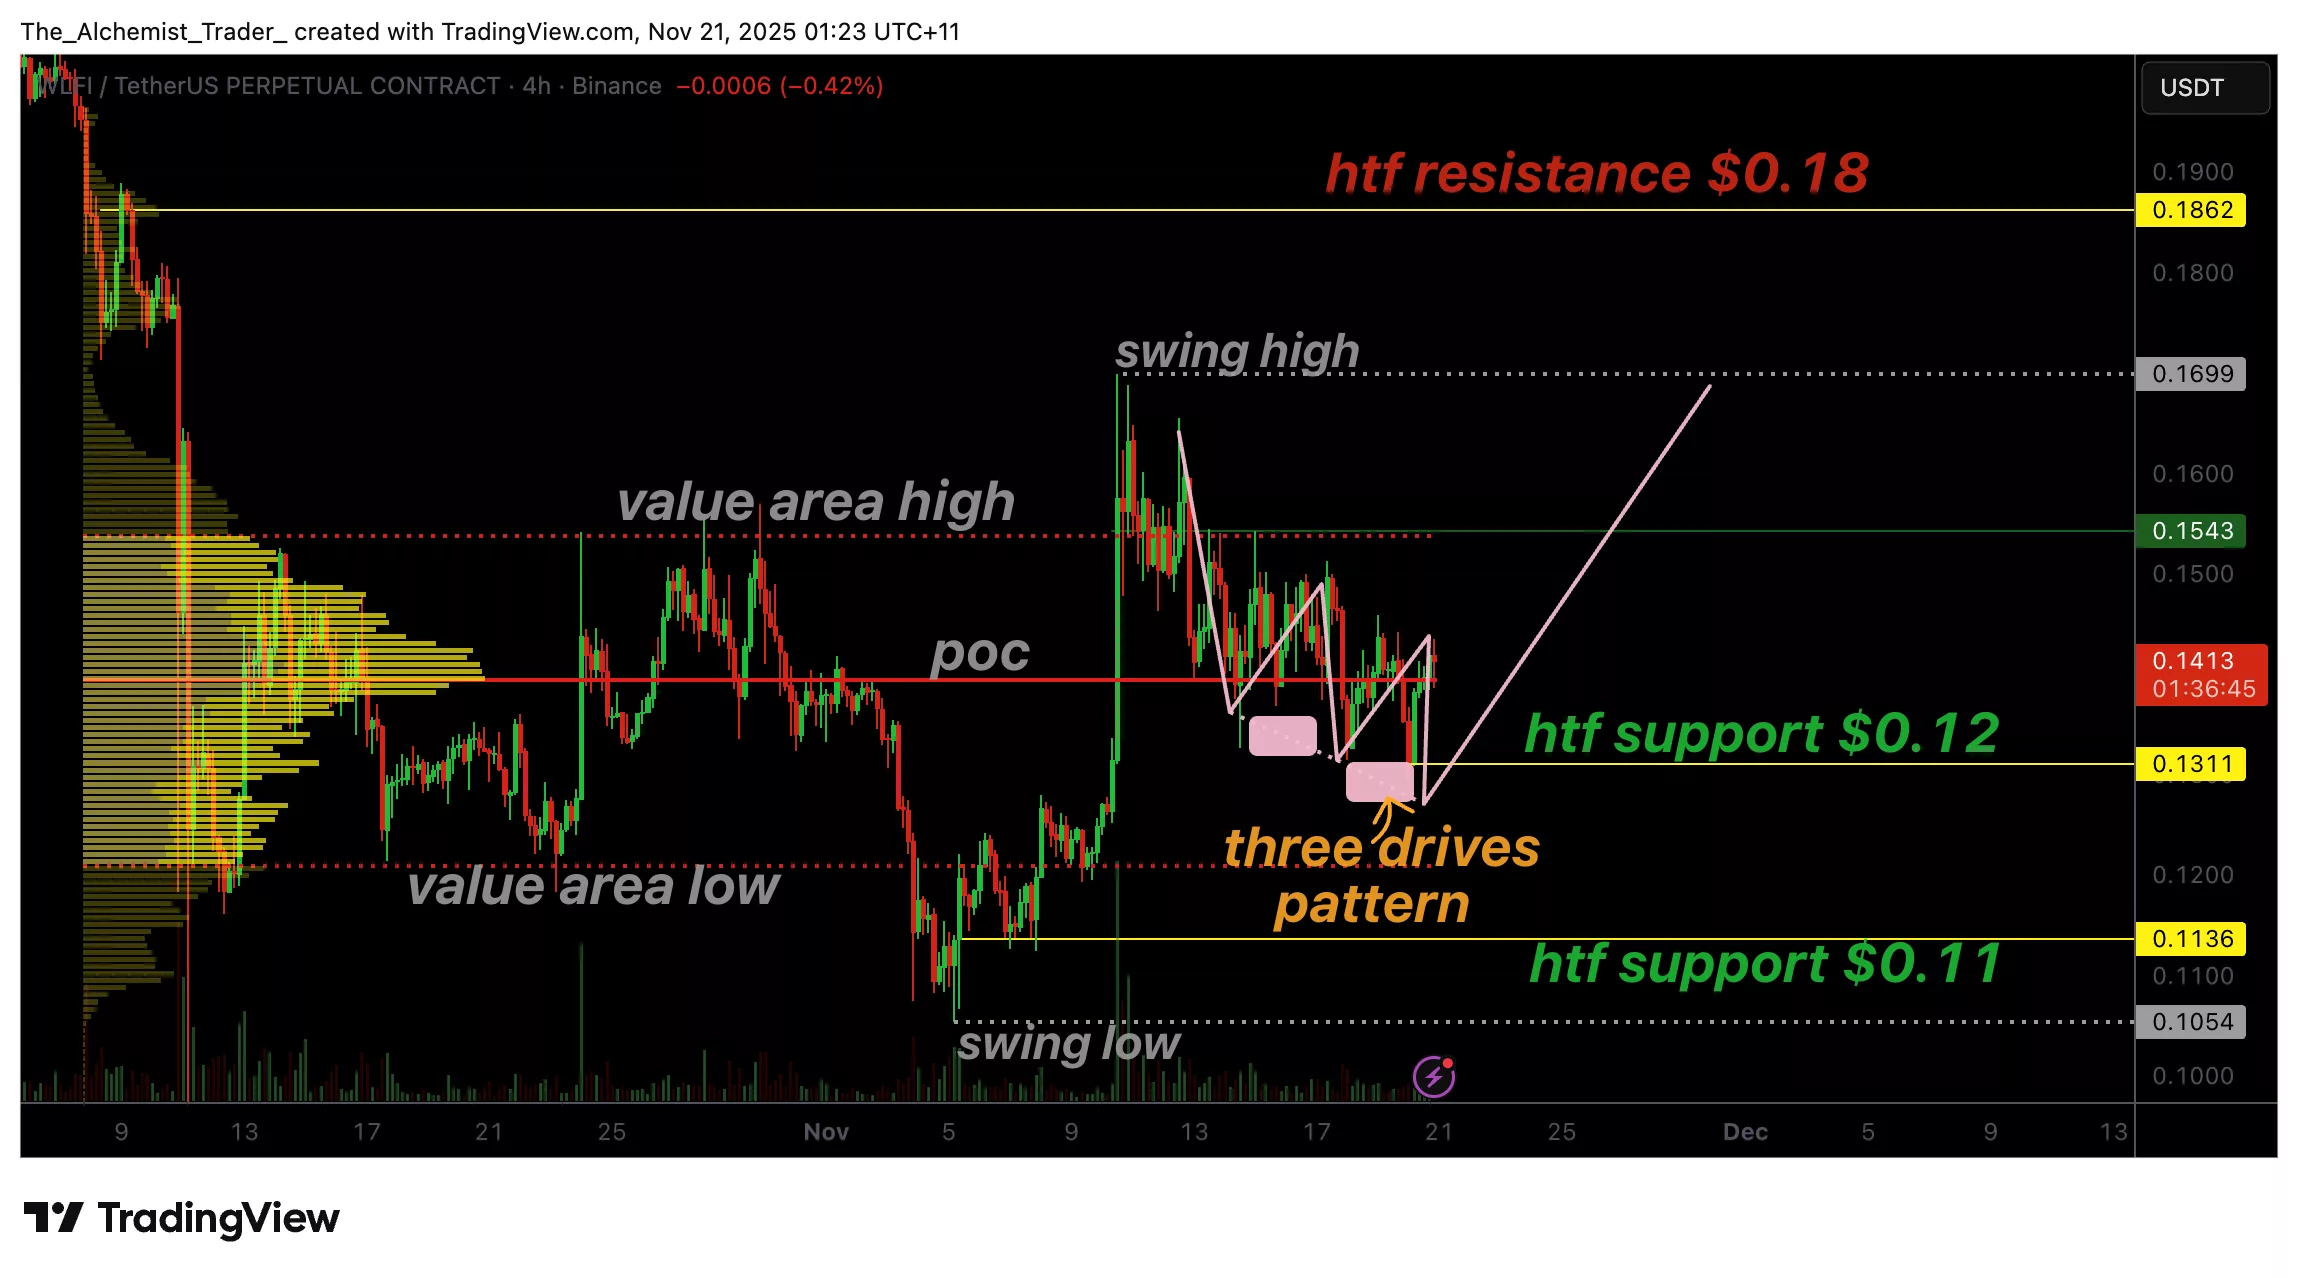
WLFI’s price structure is currently developing a textbook Three Drives pattern at the $0.12 support, a formation that often signals the end of a corrective phase and the beginning of a bullish rotation. Each test of this support has been met with strong buying interest, signalling that participants are actively defending this level. This repeated defense strengthens the argument that the market is forming a structural bottom.

The Three Drives pattern itself is traditionally viewed as a bullish reversal signal. As price makes three equalized pushes into support, momentum typically begins to shift as sellers exhaust and buyers accumulate. In WLFI’s case, rising volume further supports this pattern, suggesting that demand is increasing at a key inflection point.

Another important factor is the Point of Control (POC), which sits near the same region. High-volume nodes at support often indicate heavy accumulation, which can act as a launchpad for bullish continuation. This alignment of technical elements creates a strong confluence zone that supports the likelihood of a reversal forming.

If WLFI can hold the $0.12 support throughout the coming days and weeks, the probability of a move toward the next significant resistance at $0.18 increases. This level has historically acted as a high-time-frame barrier and would be the first major upside target in a bullish expansion. The developing structure suggests that WLFI may be transitioning out of its corrective phase, which can often appear as “bullish selling” before a trend reversal takes shape.

What to expect in the coming price action

If WLFI continues to defend the $0.12 support and completes the Three Drives reversal pattern, a rally toward $0.18 becomes increasingly likely. Breaking above this level would further confirm bullish momentum. A loss of $0.12 would delay the reversal and weaken the current setup.

The development comes on the heels of WLFI’s confirming a pre-launch breach, which stemmed from phishing and third-party security lapses.

Market Opportunity
WLFI Logo
WLFI Price(WLFI)
$0.1074
$0.1074$0.1074
-13.59%
USD
WLFI (WLFI) Live Price Chart
Disclaimer: The articles reposted on this site are sourced from public platforms and are provided for informational purposes only. They do not necessarily reflect the views of MEXC. All rights remain with the original authors. If you believe any content infringes on third-party rights, please contact service@support.mexc.com for removal. MEXC makes no guarantees regarding the accuracy, completeness, or timeliness of the content and is not responsible for any actions taken based on the information provided. The content does not constitute financial, legal, or other professional advice, nor should it be considered a recommendation or endorsement by MEXC.

You May Also Like

Microsoft Corp. $MSFT blue box area offers a buying opportunity

Microsoft Corp. $MSFT blue box area offers a buying opportunity

The post Microsoft Corp. $MSFT blue box area offers a buying opportunity appeared on BitcoinEthereumNews.com. In today’s article, we’ll examine the recent performance of Microsoft Corp. ($MSFT) through the lens of Elliott Wave Theory. We’ll review how the rally from the April 07, 2025 low unfolded as a 5-wave impulse followed by a 3-swing correction (ABC) and discuss our forecast for the next move. Let’s dive into the structure and expectations for this stock. Five wave impulse structure + ABC + WXY correction $MSFT 8H Elliott Wave chart 9.04.2025 In the 8-hour Elliott Wave count from Sep 04, 2025, we saw that $MSFT completed a 5-wave impulsive cycle at red III. As expected, this initial wave prompted a pullback. We anticipated this pullback to unfold in 3 swings and find buyers in the equal legs area between $497.02 and $471.06 This setup aligns with a typical Elliott Wave correction pattern (ABC), in which the market pauses briefly before resuming its primary trend. $MSFT 8H Elliott Wave chart 7.14.2025 The update, 10 days later, shows the stock finding support from the equal legs area as predicted allowing traders to get risk free. The stock is expected to bounce towards 525 – 532 before deciding if the bounce is a connector or the next leg higher. A break into new ATHs will confirm the latter and can see it trade higher towards 570 – 593 area. Until then, traders should get risk free and protect their capital in case of a WXY double correction. Conclusion In conclusion, our Elliott Wave analysis of Microsoft Corp. ($MSFT) suggested that it remains supported against April 07, 2025 lows and bounce from the blue box area. In the meantime, keep an eye out for any corrective pullbacks that may offer entry opportunities. By applying Elliott Wave Theory, traders can better anticipate the structure of upcoming moves and enhance risk management in volatile markets. Source: https://www.fxstreet.com/news/microsoft-corp-msft-blue-box-area-offers-a-buying-opportunity-202509171323
Share
BitcoinEthereumNews2025/09/18 03:50
Marathon Digital BTC Transfers Highlight Miner Stress

Marathon Digital BTC Transfers Highlight Miner Stress

The post Marathon Digital BTC Transfers Highlight Miner Stress appeared on BitcoinEthereumNews.com. In a tense week for crypto markets, marathon digital has drawn
Share
BitcoinEthereumNews2026/02/06 15:16
Fintech in a Fragmented World: Building Financial Products Across Geopolitical Lines

Fintech in a Fragmented World: Building Financial Products Across Geopolitical Lines

For most of the last ten years, the fintech growth story was one without borders. Startups made digital wallets, payment platforms, lending systems, and trading
Share
Globalfintechseries2026/02/06 15:17