-
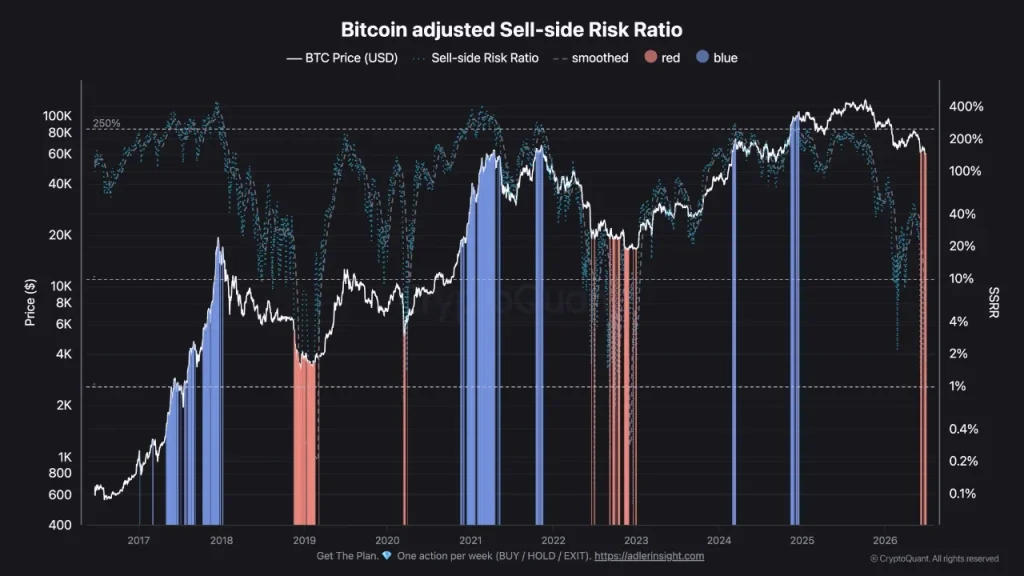
Bitcoin Sell-Side Risk Ratio has fallen back near the 1% low-risk zone.
-
Similar historical readings preceded major recoveries since 2016.
-
MVRV and NUPL indicators are also signaling undervaluation conditions.
The market loves panic near bottoms and confidence near tops. The latest Bitcoin Sell-Side Risk Ratio reading seems determined to remind traders of that uncomfortable truth once again.
The adjusted metric has now fallen back toward the low-risk zone, sitting around 1% on the logarithmic scale, firmly inside what historical data classifies as the blue accumulation territory. That’s usually where sellers run out of ammunition.
When Selling Pressure Starts To Disappear
The Sell-Side Risk Ratio measures realized profits and losses relative to realized market capitalization. In simpler terms, it tracks how aggressively market participants are cashing out.
When the ratio spikes, holders are distributing coins into strength and locking in gains.
When it collapses toward current levels, very little profit-taking remains. There’s simply less incentive to sell. Markets have seen this movie before.
Previous Signals Arrived Before Major Recoveries
As per analyst RugaResearch, historical data since 2016 shows similar readings appeared during late 2016, early 2019, March 2020, late 2022, and late 2023.
Each period eventually evolved into significant recovery phases or major bull market expansions. The common ingredient wasn’t excitement. It was exhaustion. Selling dried up before demand returned.
Multiple Valuation Metrics Flash Together Again
The signal isn’t appearing in isolation either. MVRV continues compressing toward realized price while NUPL remains in capitulation territory. The combination places several long-term valuation indicators in statistically cheap zones simultaneously.
That doesn’t guarantee the market has found its exact bottom. Markets rarely offer such generosity.
The possibility of deeper declines remains firmly on the table. Still, history suggests accumulation zones aren’t identified by comfort or certainty. They’re identified by apathy, disbelief, and a lack of willing sellers.
The current Bitcoin Sell-Side Risk Ratio suggests the market may be entering exactly that kind of environment.