Tesla Stock Hits $420 With Burry Betting Against It Before Q2 Data

Tesla stock reclaimed key moving averages to close June at $420.60, but the recovery faces mounting valuation concerns and a high-profile short position. The Q2 delivery report now looms as the decisive near-term catalyst for TSLA.
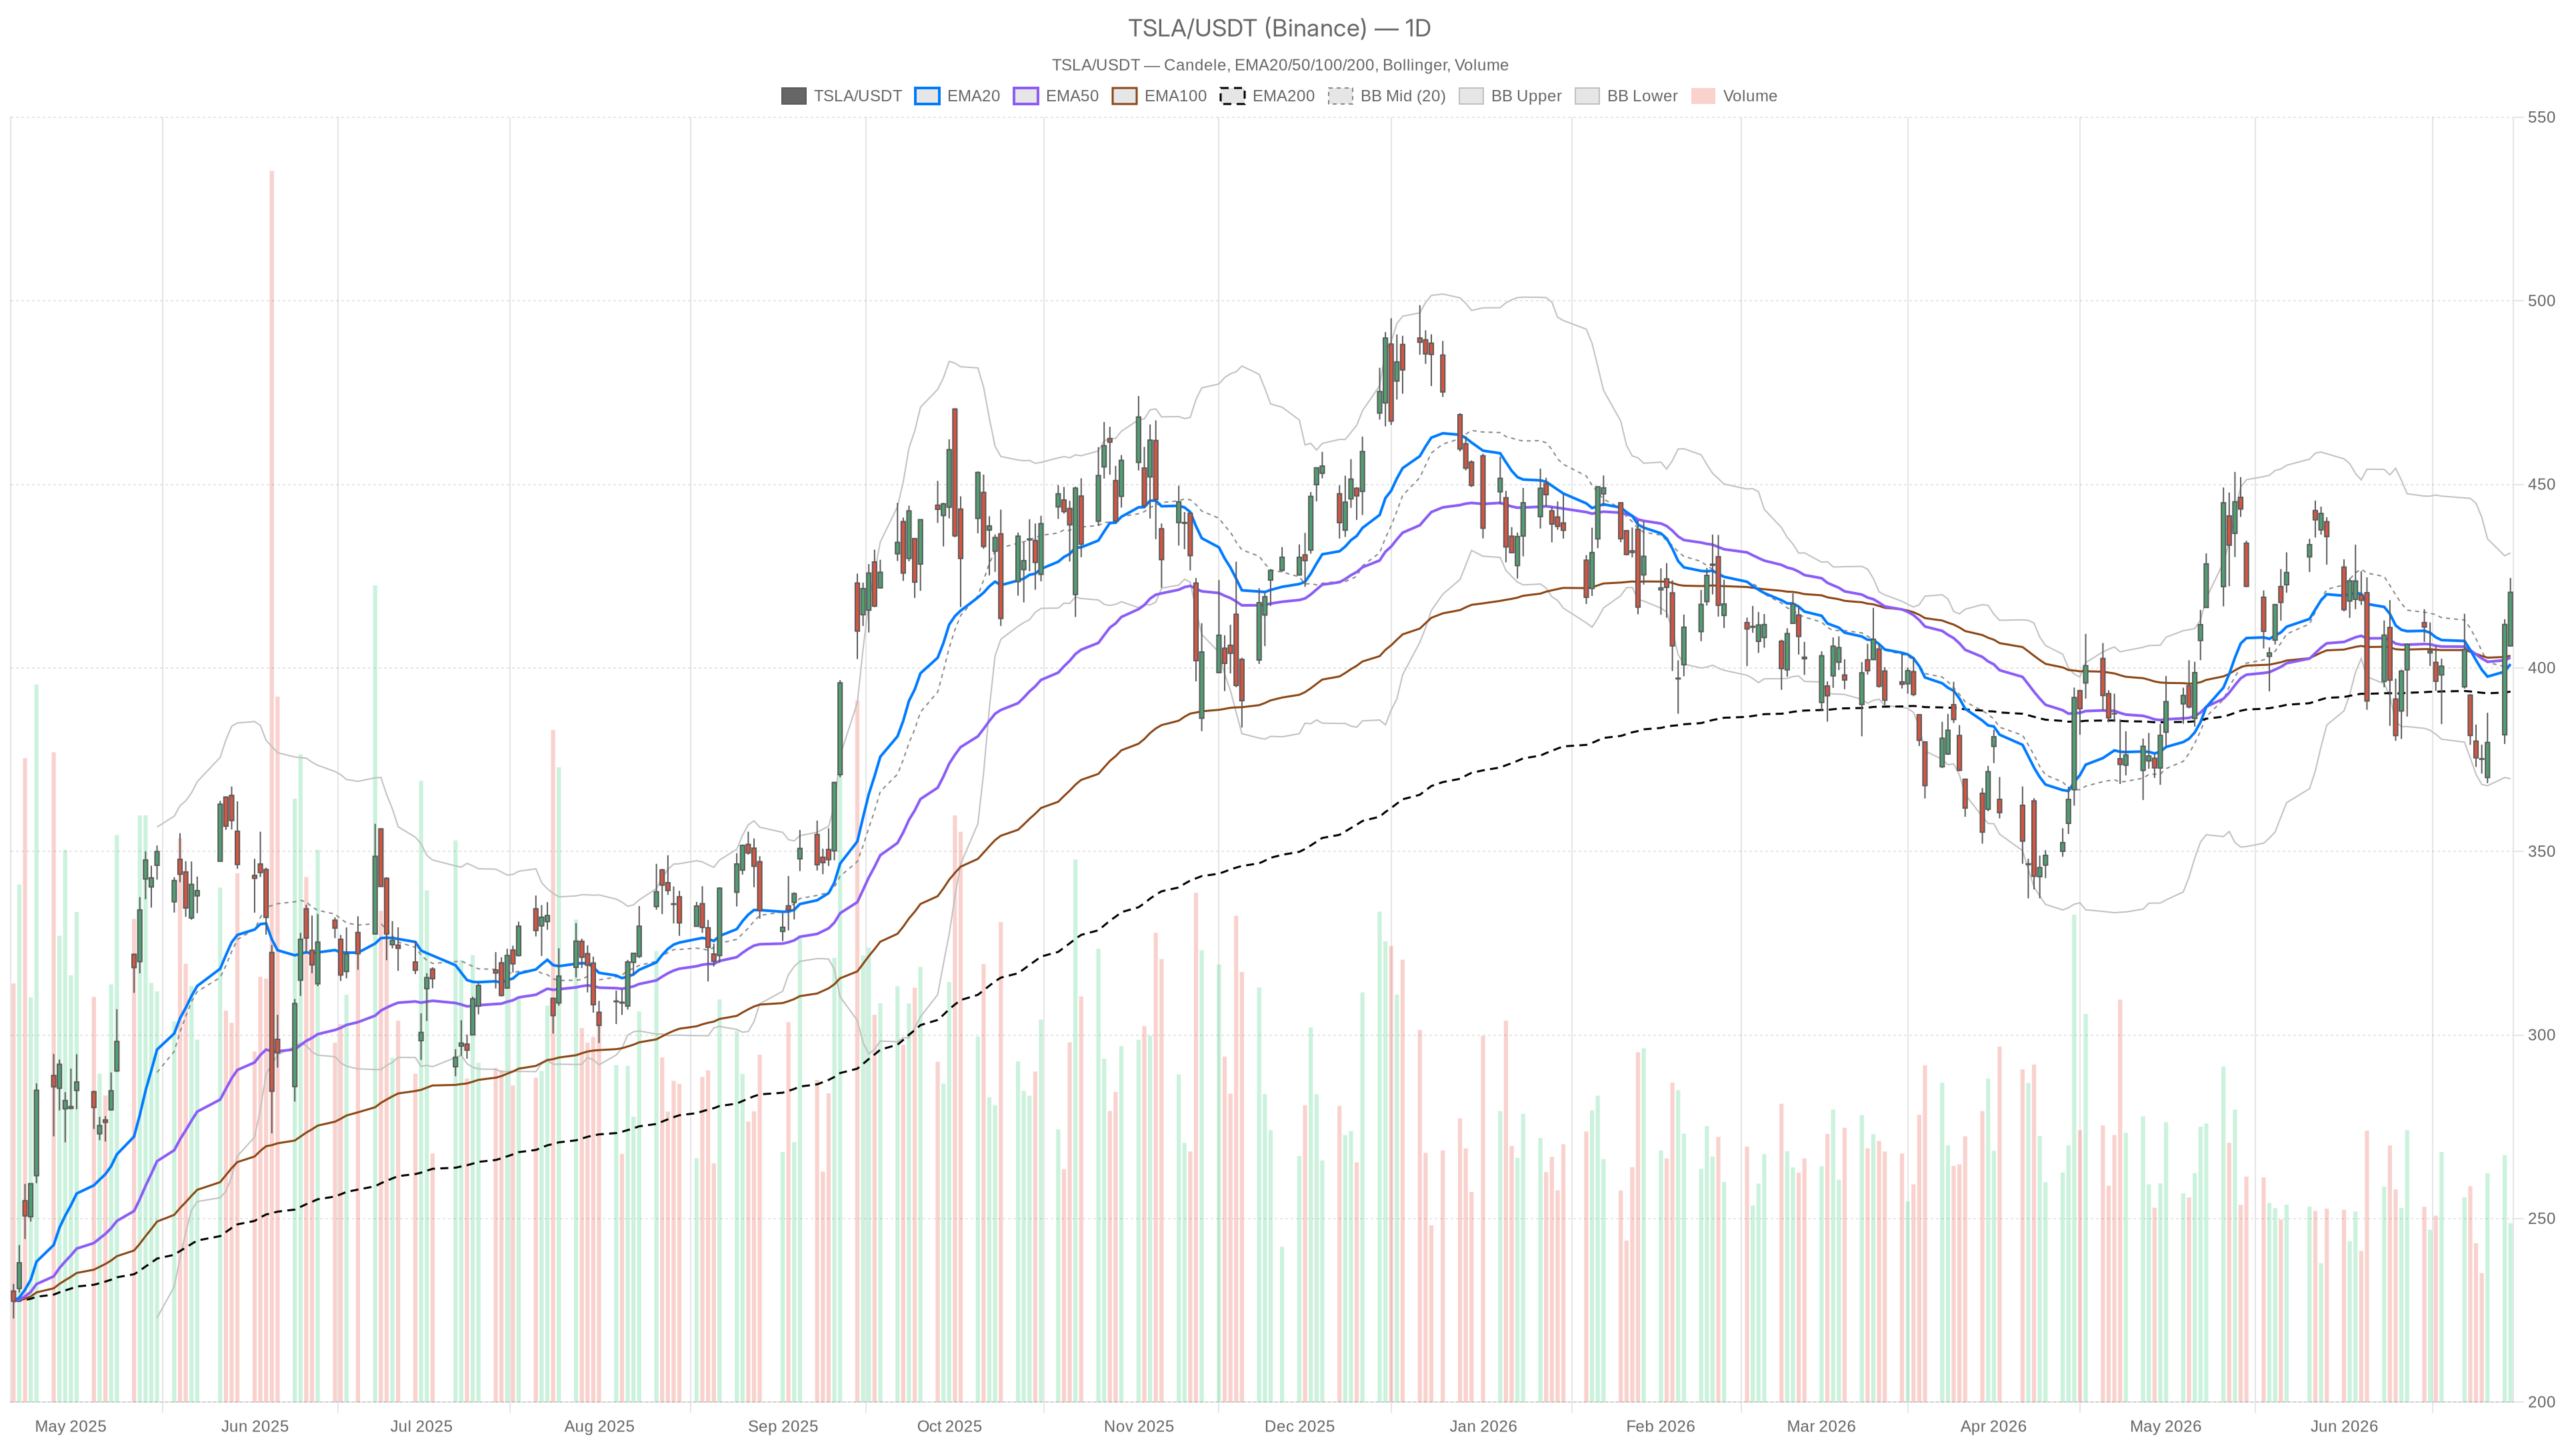 TSLA — daily chart with candlesticks, EMA20/EMA50 and volume.
Key takeaways
- Tesla stock closed June at $420.60, reclaiming its EMA20, EMA50, and EMA200 in a bullish alignment.
- The daily RSI at 56.78 reflects measured momentum, while the MACD histogram turned positive at +1.08, signaling fading downward pressure.
- The hourly RSI at 74.8 sits firmly in overbought territory, suggesting short-term consolidation is likely before any sustained move higher.
- Michael Burry disclosed a short position initiated at $416.22, adding psychological weight to bearish sentiment around the stock.
- The Q2 delivery report is the primary near-term catalyst, with international sales expected to offset softening US volumes.
Daily technical structure shows cautious improvement
The daily chart for Tesla stock presents a cautiously constructive picture, with price above all three key exponential moving averages and momentum quietly improving.
Price trades above the EMA20 at $401.06, the EMA50 at $402.81, and the EMA200 at $393.57. That stack is in bullish alignment. The close at $420.60 sits comfortably above the daily pivot point of $417.05, reinforcing near-term buyer control. The first daily resistance level stands at $428.09. It closely tracks the upper Bollinger Band at $431.35, giving the market a defined ceiling to challenge.
Meanwhile, the daily RSI at 56.78 reflects measured bullish momentum. It is not overbought, not stalling at a ceiling, and not in a zone that typically triggers mean-reversion selling. The MACD remains in negative territory. However, the histogram has flipped positive at +1.08, signaling that downward momentum is fading rather than accelerating. The daily ATR at $17.48 confirms a market with meaningful intraday range — useful context for setting realistic expectations around the delivery data release.
Hourly chart warns of overbought conditions
The hourly chart for TSLA tells a different story — one of near-term exhaustion after a strong rally, with the RSI firmly overbought and price struggling to hold highs.
On the hourly chart, the RSI sits at 74.8, firmly in overbought territory. The hourly MACD remains positively aligned with a histogram of +1.86, confirming strong recent upward momentum on this timeframe. Yet price at $420.32 on the latest hourly candle hovers right around the 1H pivot of $421.47. There is clear evidence of near-term exhaustion.
The market reached $423.80 intraday and pulled back without closing at the high. That behavior, combined with an overbought RSI, suggests the hourly chart is stretched and likely needs consolidation before extending higher. The daily and hourly frames are therefore in partial conflict. The daily says room to run exists. The hourly says the immediate move may be overdone.
This is a common setup where the medium-term bias remains intact, but short-term traders face a less favorable entry point. Chasing at current levels carries real short-term pullback risk. The 1H support sits at $419.15, while broader daily support at $409.55 remains well below.
15-Minute timeframe confirms intraday digestion
The 15-minute chart for Tesla stock is the only timeframe carrying an outright bullish label, but even here, short-term momentum is beginning to fade.
The 15m EMA structure shows price trading above the EMA20 at $418.46, the EMA50 at $410.55, and the EMA200 at $397.03. All are in clean bullish alignment. However, the 15m MACD histogram has just ticked negative at -0.19. That is a small but real signal of short-term momentum fading.
Combined with an RSI at 61.99 — healthy but not explosive — the 15-minute frame reads as a market that has had its intraday push and is now digesting gains near the top of the Bollinger Band at $424.09. The overall picture across timeframes points to a Tesla stock recovery that is technically valid but increasingly stretched at current levels.
Fundamental pressures mount for Tesla Stock
Beyond the charts, Tesla stock faces a convergence of fundamental pressures that complicate the technical recovery, with the Q2 delivery report serving as the most immediate catalyst.
Tesla will report Q2 delivery numbers imminently. Analysts preview a story where international and European sales are doing the heavy lifting as US volumes continue to soften. That divergence matters. A headline delivery beat driven entirely by non-US markets may not land as positively as a broad-based recovery would. The market is sensitive to narrative, not just numbers.
Notably, Michael Burry has disclosed a short position initiated at $416.22, citing the bounce to that level as his entry signal. Burry’s timing carries psychological weight in markets even when his macro calls are contested. At the same time, Gary Black — a longstanding TSLA follower — sees a potential delivery beat but still declines to own the stock. That combination says something real about the risk-reward at current prices.
In contrast, merger speculation narratives circulating in the press add a speculative premium to the stock. That premium is difficult to price with any precision. Overvaluation concerns are explicitly surfacing, with commentary highlighting that at $420.60 the stock leans expensive relative to fundamental metrics. This does not make TSLA uninvestable, but it does mean the margin for error on the delivery report is narrow.
Bullish scenario for Tesla Stock
A clean Q2 delivery beat would likely shift Tesla stock’s daily regime from neutral to bullish, provided the international strength is broad enough to offset US softness.
The bullish scenario rests on a delivery beat combined with a daily close above $428. That would challenge the upper Bollinger Band near $431. In that case, the neutral daily regime would likely shift to bullish. The MACD histogram would continue expanding positively, and the EMA stack alignment would confirm the breakout. The 1H overbought condition would resolve through sideways consolidation rather than a sharp pullback. This would be the healthiest technical outcome for the stock.
Bearish risks and downside catalysts
A disappointing delivery report — or one that reveals continued US market share erosion — could trigger a sharp reversal in Tesla stock, with multiple support levels coming into play.
A delivery miss or a report that beats on headline numbers but reveals structural weakness could spark a selloff. The first meaningful daily support sits at $409.55, followed by the EMA cluster between $401 and $403. A break below the daily pivot at $417.05 on volume would be the first warning sign that the recent recovery is failing.
The Bollinger Band midline at $400.59 represents a more serious unwind target. Burry’s short position would gain credibility quickly in that scenario. Overall, Tesla stock sits at a technical inflection point where the medium-term structure is quietly improving but short-term momentum is stretched and macro catalysts are binary.
The daily timeframe supports a cautiously bullish bias. The hourly chart demands patience rather than aggression. Volatility — with an ATR of $17.48 on the daily and the delivery report as a live catalyst — is likely to expand meaningfully in the sessions ahead. Positioning ahead of that event requires an honest assessment of risk tolerance, not conviction in a single directional view.
FAQ
What is the key technical level to watch for Tesla stock?
The first daily resistance at $428.09, closely aligned with the upper Bollinger Band at $431.35, is the critical upside level. A daily close above this zone would confirm a shift from neutral to bullish for Tesla stock.
Why is Michael Burry’s Tesla short position significant?
Burry disclosed a short at $416.22, and his timing carries psychological weight in markets. Combined with valuation concerns at $420.60, the short adds credibility to the bearish case if the Q2 delivery report disappoints.
What does the hourly RSI at 74.8 mean for Tesla stock?
The hourly RSI in overbought territory signals that short-term momentum is stretched. This suggests consolidation or a pullback is likely before any sustained move higher, even if the daily bias remains constructive.
Disclaimer: This article is for informational purposes only and does not constitute financial advice, an investment recommendation, or a solicitation to buy or sell any financial instrument or cryptocurrency. The analysis provided is not indicative of future results. Investing in crypto assets and financial markets carries a high risk of capital loss. Always do your own research (DYOR) and consult a qualified financial advisor before making any decision.
Article produced with the assistance of artificial intelligence and reviewed by the editorial team.


You May Also Like

BlackRock Transfers $212M in Bitcoin to Coinbase, Signaling ETF Activity

Belgium vs Senegal Tactical Preview: World Cup 2026 Game Plan, Key Battles and Match Prediction