

Bitcoin Warning: Everyone Is Waiting for the Same Bottom – That’s Exactly Why You’ll Get Trapped
The Bitcoin price is down 0.98% today, trading at $58,969.51. The broader crypto market lost 0.69%, and fear is still running the show.
The main issue is institutional selling through spot Bitcoin ETFs. U.S. ETFs are on track to see over $4.1 billion leave in June 2026, the biggest monthly outflow since they launched. Big money is pulling back as macro uncertainty drags on risk assets.
Breaking below $60,000 made things worse. More than 550,000 BTC moved into Binance and OKX deposit addresses, which means more people getting ready to sell. Also, traders loaded up on July put options at $55,000 and $58,000, betting on another drop.
Bitcoin Bottom Prediction Could Be Setting Traders Up for a Trap
Top analyst Julien CryptoBoost believes one of the biggest risks facing Bitcoin traders is that almost everyone expects the market to bottom around November, near the end of the current cycle and close to the U.S. midterm elections. His argument is that markets rarely reward the most obvious trade, especially when millions of investors are waiting for the same event.
His reasoning centers on how Bitcoin’s market structure has changed. Earlier cycles were driven mainly by retail investors, allowing price action to follow a fairly predictable post-halving timeline.
That pattern changed during this cycle as institutional investors, ETFs, hedge funds, and algorithmic traders became much larger participants. Those investors constantly price in future events, meaning major turning points can happen months before the crowd expects them.
CryptoBoost also points to the Bitcoin price reaching a new all-time high before the 2024 halving, something that had never happened in previous cycles. He argues this broke the historical cycle template.
He adds that an on-chain indicator that has identified major Bitcoin bottoms since 2016 flashed this week, implying capitulation may already be underway. His view is that accumulating across the current price zone makes more sense than waiting for a specific date that everyone else has already marked on their calendars.
Bitcoin Cycle Chart Shows Why History May Not Repeat Perfectly
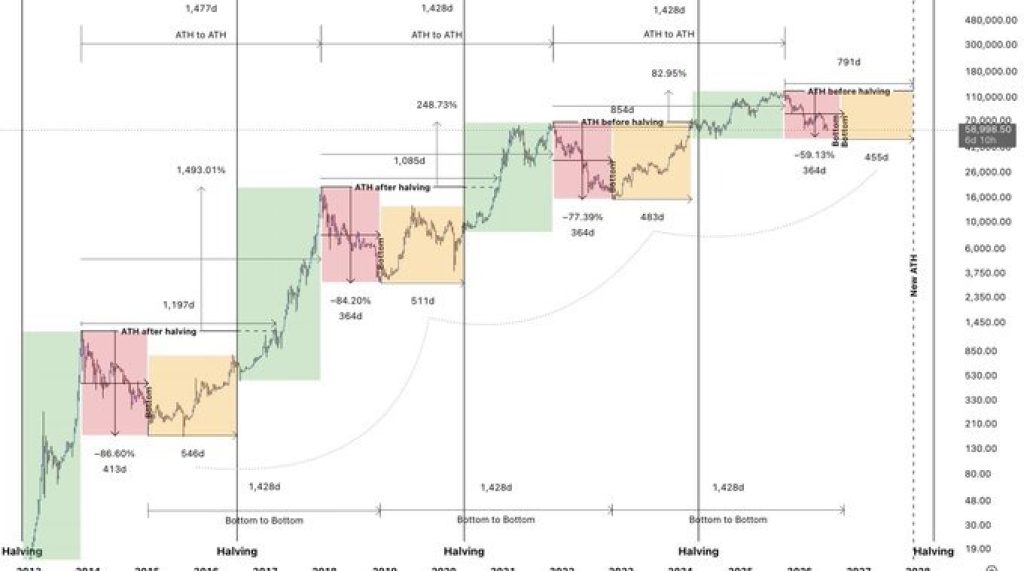
The chart compares Bitcoin’s four major market cycles, starting from each halving event through the following bull market, correction, and recovery. Every cycle produced a rally after the halving, ranging from nearly 250% in the latest cycle to well over 1,400% during Bitcoin’s earlier years. As Bitcoin matured and market capitalization expanded, each cycle produced smaller percentage gains than the previous one.
 Source: X/JulienCryptoBoost
The chart also shows how the Bitcoin price has corrected after each cycle top. It fell about 86.6% after the 2013 peak, 84.2% after 2017, and 77.4% following the 2021 high.
This time around, it’s down roughly 59.1% from its all-time high. That’s a much smaller drop than past bear markets. And that’s exactly why analysts are split, nobody agrees on whether we’ve already seen the bottom.
Another key feature is timing. Previous cycles reached new all-time highs well after each halving. This cycle broke that sequence by printing a record high before the halving, supporting the argument that institutional participation has accelerated Bitcoin’s historical rhythm. If that pattern continues, investors relying solely on old cycle dates may find themselves reacting after the market has already moved.
Related Bitcoin News: Here’s Where Bitcoin (BTC) Price Could Be Headed In July
News Pushing Bitcoin price Lower Today
BitcoinIntel reported that Binance, Coinbase, and Bybit were sending millions of dollars worth of Bitcoin into the market ahead of the U.S. trading session, contributing to Bitcoin’s drop toward $59,189. Large exchange inflows often increase available selling liquidity, though they do not automatically guarantee that every coin will be sold.
Market analyst Lukasz Wydra also pointed to another concern. Stablecoin balances across exchanges dropped from $62.46 billion to $61.80 billion in only one day. Stablecoins typically represent available buying power, so declining balances indicate less capital is sitting on exchanges ready to purchase Bitcoin as the month comes to a close.
Blockchain Master pointed out that Bitcoin’s drop into the $58,000–$59,000 range triggered over $1 billion in liquidations. That also came with one of the biggest weekly ETF outflow totals on record. But on-chain data still shows long-term holders hanging onto their coins. That tells us leveraged traders took most of the hit—not the people with longer time horizons.
Our Take: Bitcoin Price May Reward Flexibility, Not Fixed Dates
This Bitcoin drop isn’t a mystery. You can point to real things driving it: record ETF outflows, shrinking stablecoin reserves on exchanges, more coins flowing into exchanges, and heavy derivatives bets piling up. Those numbers explain why selling pressure is still high, even after BTC has already dropped nearly 60% from its top.
The bigger question is timing. Historical cycles remain useful, but this market is no longer driven by the same participants that dominated previous halvings. Institutional capital has changed how quickly information is priced into Bitcoin.
That does not guarantee the bottom is already in, nor does it confirm another major decline. It simply means investors relying on one specific calendar date may face the greatest risk if the market moves before consensus expects it.
Frequently Asked Questions

Strategy introduced a Bitcoin Monetization Program that allows it to sell up to $1.25 billion worth of Bitcoin if needed to strengthen its USD Reserve, which is used to fund preferred stock dividends and interest payments.
While a drop to $10,000 is technically possible, market analysts consider it an extreme tail-risk event rather than a consensus expectation. For Bitcoin to reach $10,000, it would need to fall roughly 85% to 90% from its current levels, which would require an unprecedented macroeconomic collapse.
It could, but buyers need to keep the BTC price above $59,400 and push it through resistance levels around $62,000 and eventually $71,562.
Subscribe to our YouTube channel for daily crypto updates, market insights, and expert analysis.
The post Bitcoin Warning: Everyone Is Waiting for the Same Bottom – That’s Exactly Why You’ll Get Trapped appeared first on CaptainAltcoin.


You May Also Like

Q2 Market Insights: Bitcoin regains dominance in risk-averse environment, ETFs remain critical to market structure

Canada Exports increased to $66.31B in February from previous $62.48B


