

Price Prediction: Figma Stock Could Double This Year
The post Price Prediction: Figma Stock Could Double This Year appeared first on 24/7 Wall St..
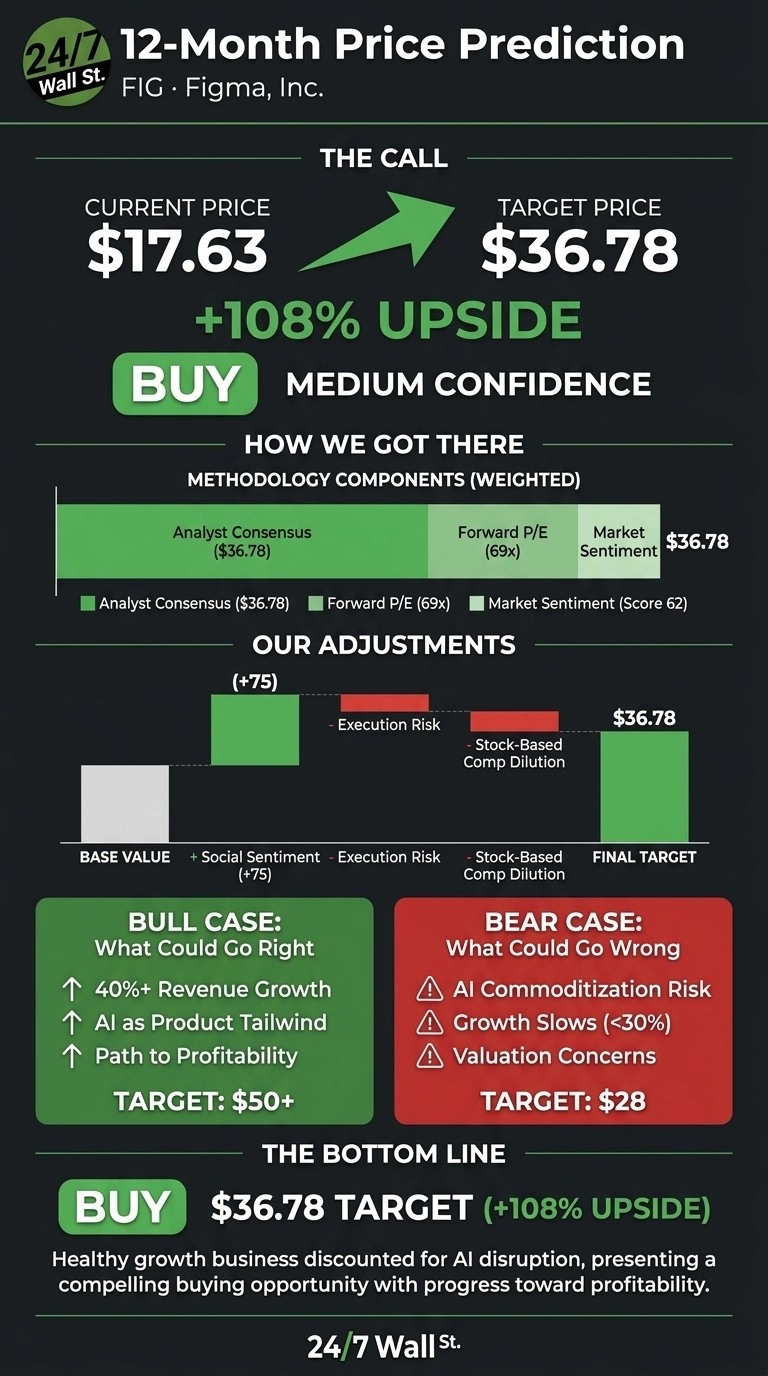
Few stocks have fallen as far, as fast, as Figma (NYSE:FIG). After a blockbuster debut, the design software platform has retraced almost everything. The question now is whether the selloff has gone too far. Our model says yes.
Our 24/7 Wall St. price target for Figma is $36.78 over the next 12 months, implying meaningful upside from current levels. The recommendation is buy, with medium confidence. The setup combines a battered share price, 46.1% revenue growth, and a sentiment composite that has turned constructive despite rough headlines.
 24/7 Wall St.
24/7 Wall St. Price Target Summary
| Metric | Value |
|---|---|
| Current Price | $17.63 |
| 24/7 Wall St. Price Target | $36.78 |
| Upside | 108.68% |
| Recommendation | BUY |
| Confidence Level | 62% |
From $143 IPO Pop to $18: How We Got Here
Figma is down 50.12% year to date and 83.86% from its post-IPO peak, with the stock sliding another 17.92% over the past month. Shares sit near the $16.60 52-week low and roughly $142.92 below the high. A June 14 Benzinga piece framed the move as driven by AI disruption fears.
Q1 told a different story: revenue grew 46% year over year to $303.78 million, paid subscribers expanded, and management guided positively. A $226.56 million GAAP net loss from stock-based compensation kept bears engaged.
Insider selling from CEO Dylan Field, the CFO, and the CTO totaling roughly $14.5 million were disclosed under pre-arranged Rule 10b5-1 plans, softening the signal while leaving sentiment intact.
The Case for $50+
Bulls have a real argument. Figma owns a category. Designers, product managers, and engineers collaborate on it daily, and the platform has emerged as core infrastructure inside enterprises.
JPMorgan, Royal Bank of Canada, and Piper Sandler have flagged a significant rebound driven by Figma’s essential role in design, a strong cash position, and the potential to convert AI from threat to tailwind via generative design tooling. Analysts expect Figma to achieve profitability in 2026. If revenue compounds north of 40% and operating leverage shows up, the stock revisits the $50 to $60 zone within our 12-month window.
The Risks Worth Watching
The bear case starts with AI. If foundation-model providers commoditize design generation, Figma’s pricing power erodes. The TTM operating margin of -41.2% and EPS of -4.07 leave little room for a multiple rerating if growth slows. Stifel and Piper Sandler have trimmed targets, citing AI uncertainty and valuation concerns, and Findell Capital Management has pushed for governance changes.
RBC’s Rishi Jaluria holds a Hold rating with a $28 target, a reasonable downside scenario if growth decelerates toward 30%. Bulls counter that Figma’s losses reflect deliberate reinvestment with intact unit economics, and gross margins remain best-in-class.
Figma Price Prediction 2026-2030
The 24/7 Wall St. price target is $36.78, the recommendation is buy, and confidence is medium. The factor tipping the scale is the gap between a fundamentally healthy growth business and a stock price that already discounts severe AI disruption.
I’d be a buyer if Q2 delivers another 40%+ revenue quarter with progress toward GAAP profitability. I’d stay on the sidelines if growth slips below 30% or insider selling broadens beyond pre-arranged plans.
Here is where our model projects Figma could trade in the coming years, assuming current growth trajectories and market conditions hold.
| Year | 24/7 Wall St. Price Target |
|---|---|
| 2026 | $36.78 |
| 2027 | $44 |
| 2028 | $52 |
| 2029 | $60 |
| 2030 | $68 |
These projections assume Figma continues executing on its current strategy and converts AI into a product tailwind rather than a competitive threat. Significant upside or downside could result from a faster path to profitability or accelerated commoditization of design software.
Don't wait: the analyst who called NVIDIA in 2010 just revealed his top 10 AI stocks. See the full list FREE now.
The post Price Prediction: Figma Stock Could Double This Year appeared first on 24/7 Wall St..


You May Also Like

AI predicts XRP price for April 30, 2026

Trezor Academy Releases Documentary on Africa’s Bitcoin Economy, Opens Education Donations

Ripple Price Prediction: Will the CLARITY Act Trigger a Repricing Event for XRP?


