Hyperliquid has retreated more than 13% from its record high after a wave of profit-taking hit HYPE, while traders assess whether a newly formed double-top patternHyperliquid has retreated more than 13% from its record high after a wave of profit-taking hit HYPE, while traders assess whether a newly formed double-top pattern

Hyperliquid double top threatens deeper pullback as HYPE loses 13% from ATH

2026/06/19 19:00
4 min read
For feedback or concerns regarding this content, please contact us at crypto.news@mexc.com

Hyperliquid has retreated more than 13% from its record high after a wave of profit-taking hit HYPE, while traders assess whether a newly formed double-top pattern could trigger a deeper correction.

Summary
  • HYPE has dropped more than 12% from its $76.70 all-time high as profit-taking accelerates.
  • A double-top pattern on the 4-hour chart puts key support levels near $65 and $62 in focus.
  • Liquidation clusters between $70 and $72 could fuel volatility as traders battle for direction.

According to data from crypto.news, Hyperliquid (HYPE) price fell to an intraday low near $65.7 on June 19, extending losses from its June 16 all-time high of $76.70.

The pullback followed one of the strongest rallies in crypto this month, fueled by heavy derivatives activity, a short squeeze, and enthusiasm surrounding tokenized SpaceX exposure on the Hyperliquid ecosystem.

The decline has unfolded alongside a risk-off move across digital assets after Federal Reserve Chair Kevin Warsh reinforced a hawkish policy stance during his first meeting at the helm of the U.S. central bank. Higher-for-longer rate expectations strengthened the dollar and pressured speculative assets, prompting traders to reduce exposure across altcoins.

Additional pressure came from Hyperliquid’s recent token unlock. Earlier this month, roughly 9.9 million HYPE tokens entered circulation as part of a scheduled vesting event worth about $700 million at prevailing prices. Although Hyperliquid’s fee-funded buyback mechanism helped absorb much of that supply during the rally, the market has become more sensitive to any slowdown in trading activity.

Network activity remains elevated by historical standards, but perpetual trading volume has eased from the peak levels recorded during HYPE’s surge toward $77. With fewer buyback-driven purchases entering the market, short-term traders have become more willing to lock in gains after the token’s rapid ascent.

Double-top pattern puts key support levels in focus

The four-hour chart shows HYPE carving out a clear double top near the $76.70-$77 region, a pattern that often appears near local market peaks. HYPE has already broken below the 0.618 Fibonacci retracement level around $67.7 and is testing support between $64.8 and $65.

HYPE 4-hour chart forming a double-top pattern near $77, with price breaking below key Fibonacci levels as MACD and CMF turn bearish.

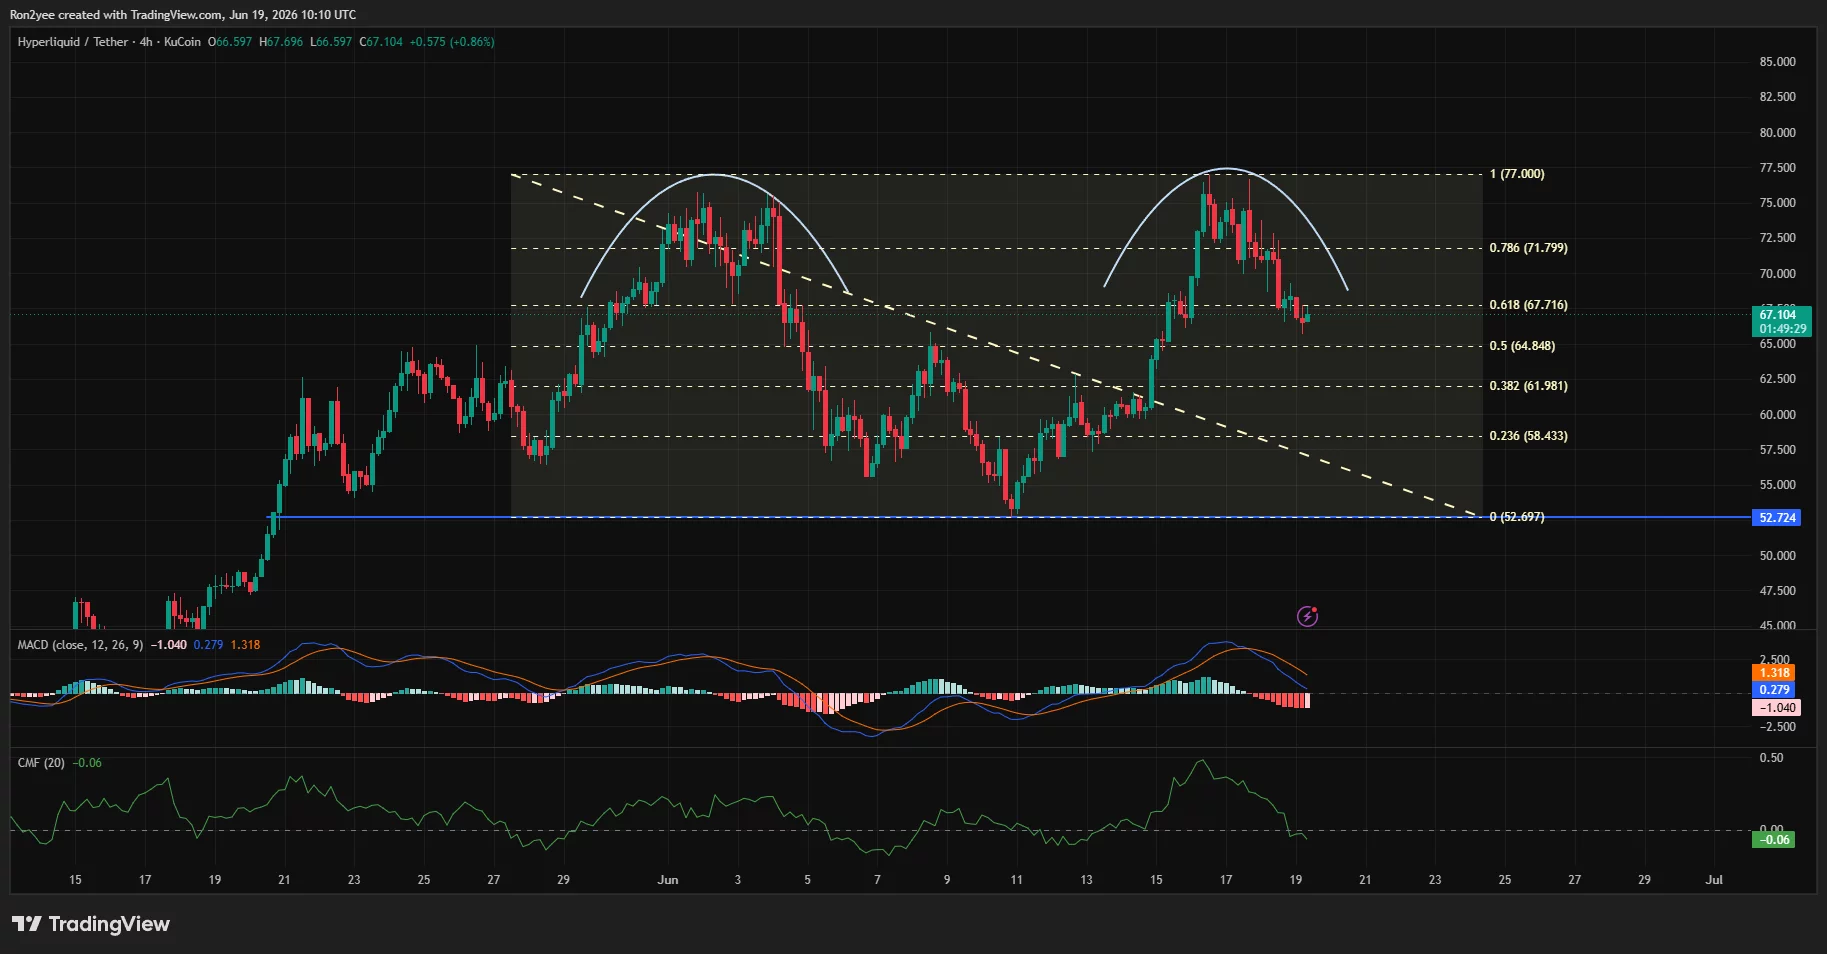
A decisive break beneath the $64.8 neckline area would strengthen the bearish setup and increase the probability of a move toward the next Fibonacci support near $62, followed by the $58.4 region. The measured target derived from the double-top structure also aligns with a potential decline toward the upper-$50 range.

Momentum indicators have weakened. On the four-hour chart, the MACD has crossed lower and remains below its signal line, while Chaikin Money Flow has slipped into negative territory at approximately -0.06, suggesting capital has been leaving the asset during the recent selloff.

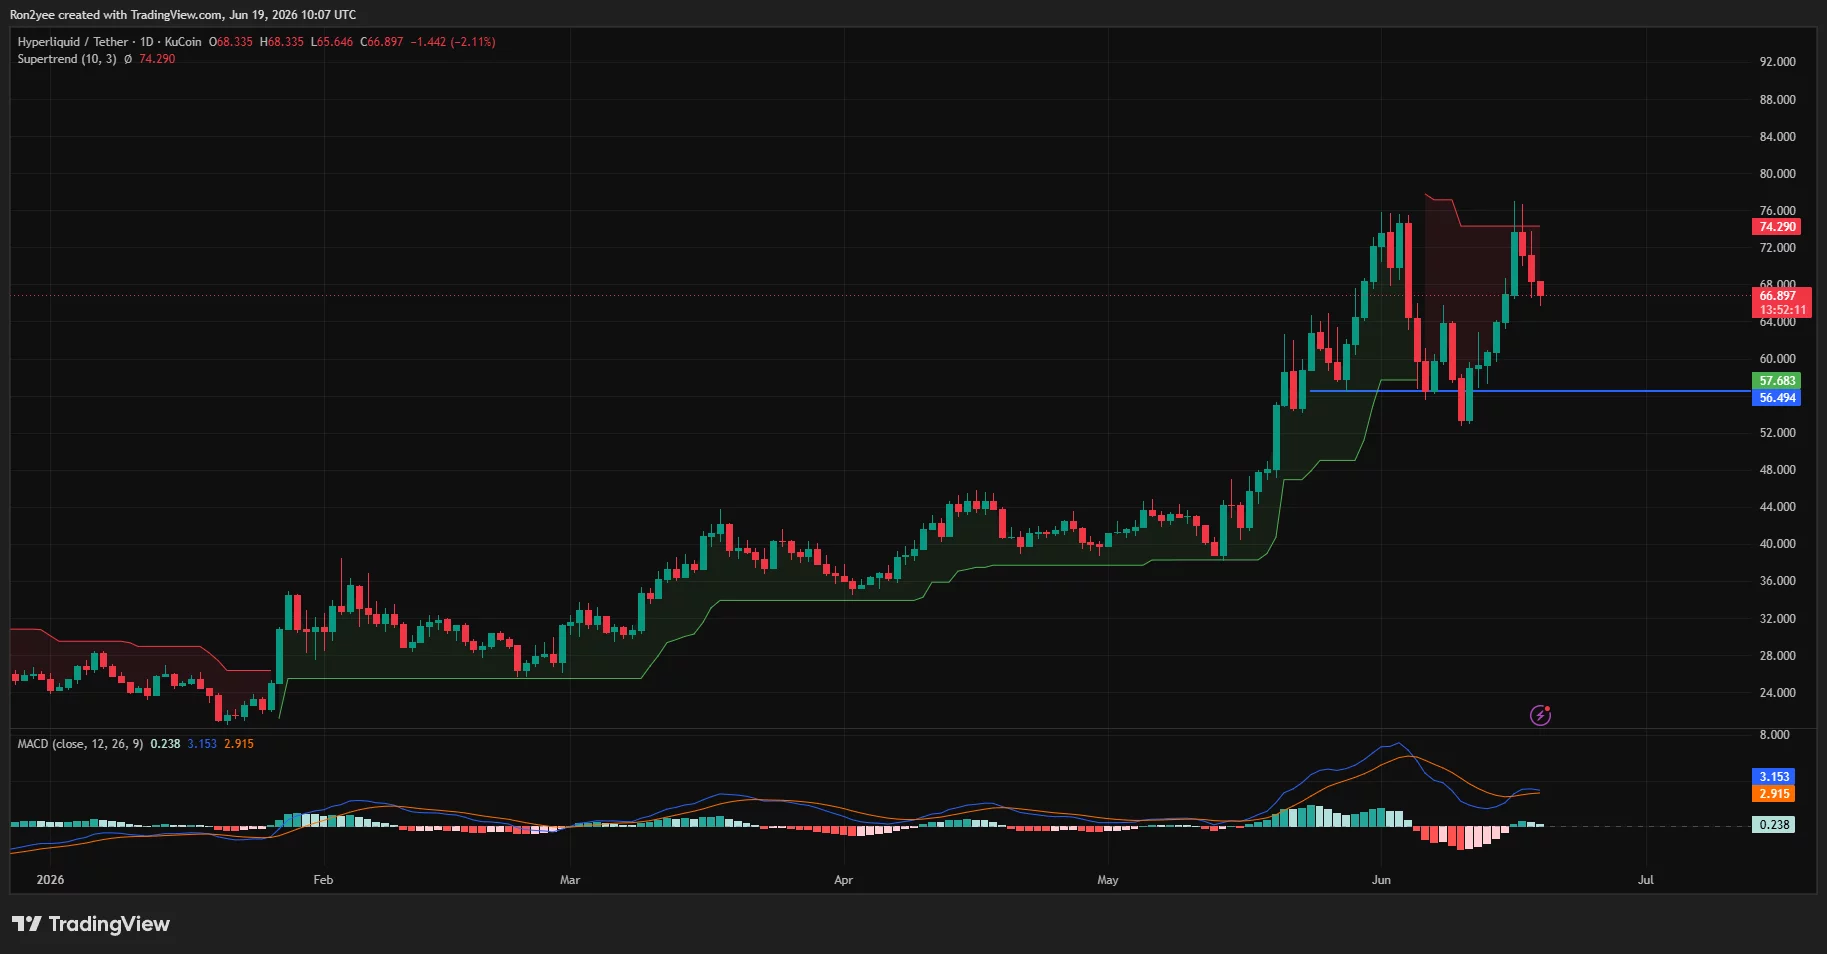
The daily chart presents a mixed picture. HYPE continues to trade above major support near $56.5, but price remains below the daily Supertrend resistance at roughly $74.3. Bulls would need to reclaim the $70-$72 zone to invalidate the immediate bearish structure and reopen the path toward the recent highs.

HYPE daily chart showing a pullback from the $76.70 all-time high while holding above major support near $56.5, with price trading below Supertrend resistance around $74.3.

Liquidation clusters create battleground between $70 and $72

CoinGlass liquidation heatmap data shows a dense concentration of leveraged positions between $69.5 and $72. Strong liquidation bands are clustered around $70 and $71.8, creating a magnet zone if buyers regain control.

HYPE liquidation heatmap highlighting major leverage clusters between $70 and $72, with additional liquidity pockets concentrated around the $65-$64 support zone.

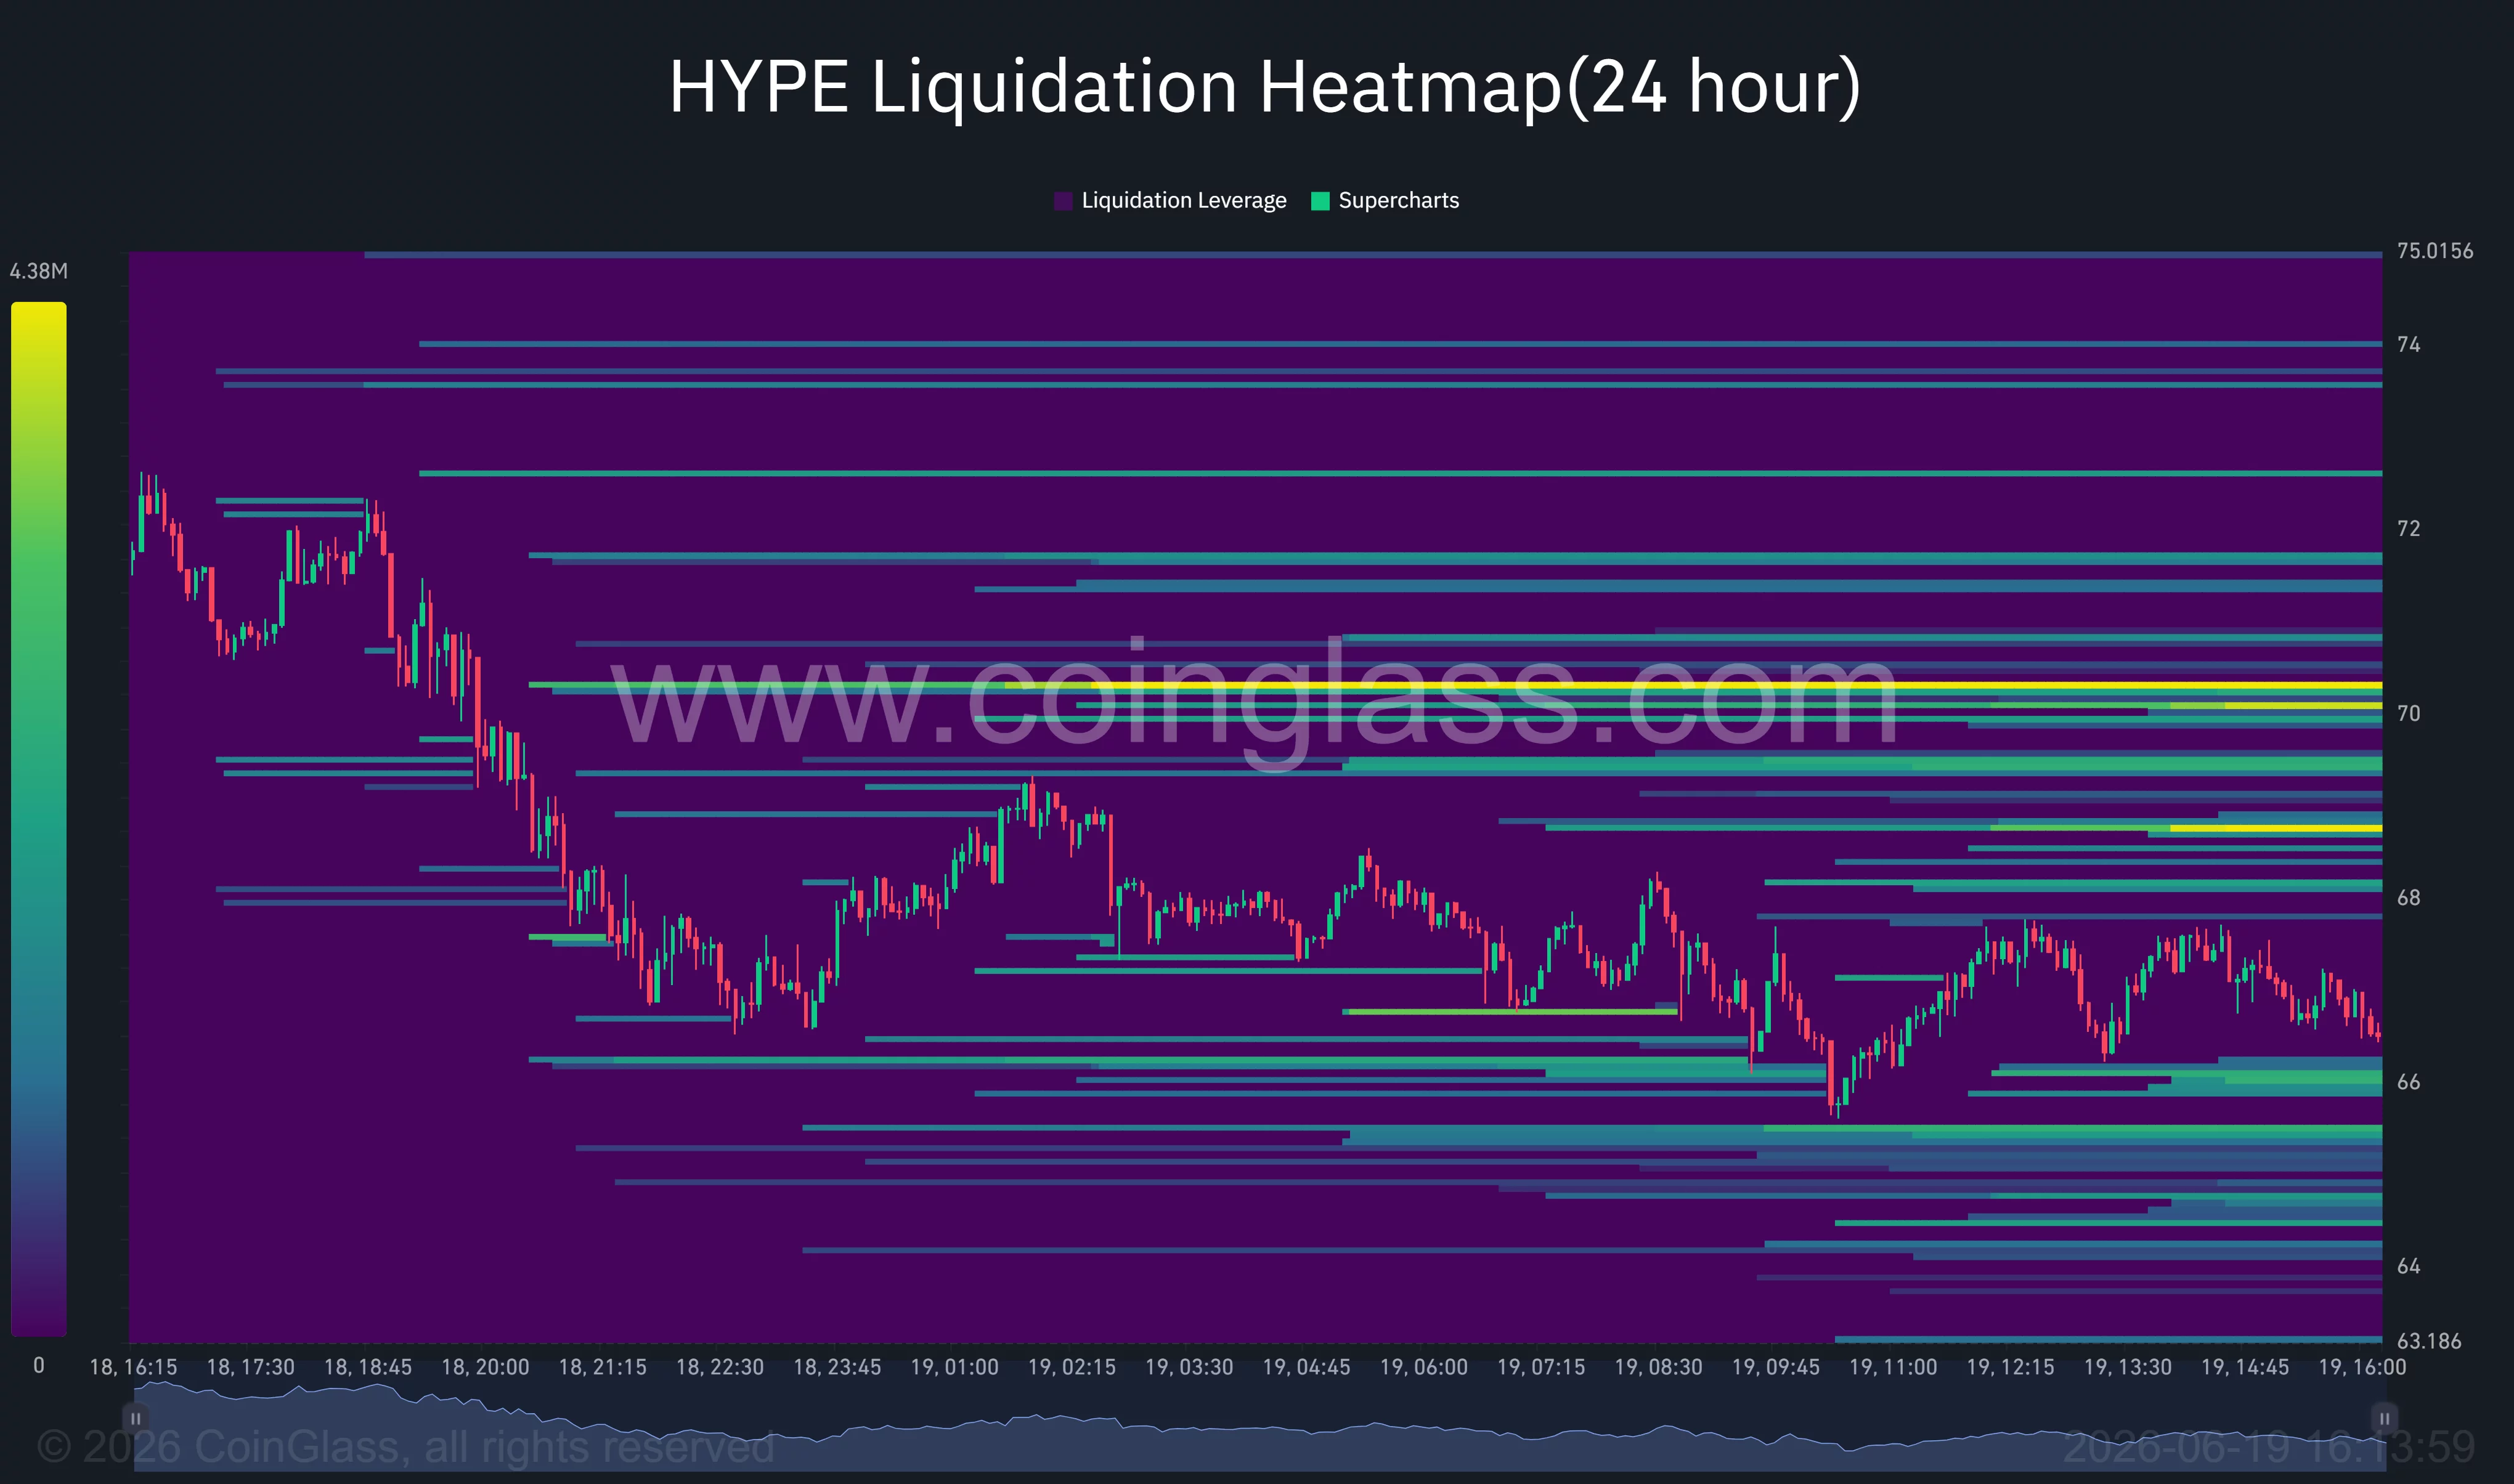
Meanwhile, sizeable liquidity pockets have formed below the market around $65 and $64. A breakdown into those levels could trigger another round of long liquidations and accelerate downside volatility.

According to analyst Lennaert Snyder, Bitcoin recently swept liquidity around $62,300 and may seek lower levels before establishing a durable bottom. While Snyder’s comments focused on Bitcoin, continued weakness in the market leader could add pressure across high-beta assets such as HYPE.

“$BTC swept 62.3K liquidity and hit our target,” Snyder wrote, adding that he would prefer to see fresh lows below $59,000 before considering a more durable reversal.

A recovery in crypto sentiment, renewed derivatives activity, and a move back above $70 would improve HYPE’s outlook. Until then, traders remain focused on whether the double-top breakdown extends toward the mid-$50 support zone or stabilizes before a larger trend reversal develops.

Disclosure: This article does not represent investment advice. The content and materials featured on this page are for educational purposes only.

Market Opportunity
Hyperliquid Logo
Hyperliquid Price(HYPE)
$69.1
$69.1$69.1
+2.18%
USD
Hyperliquid (HYPE) Live Price Chart

World Cup Combo: Aim for 200x

World Cup Combo: Aim for 200xWorld Cup Combo: Aim for 200x

Combine up to 20 World Cup matches in one order

Disclaimer: The articles reposted on this site are sourced from public platforms and are provided for informational purposes only. They do not necessarily reflect the views of MEXC. All rights remain with the original authors. If you believe any content infringes on third-party rights, please contact crypto.news@mexc.com for removal. MEXC makes no guarantees regarding the accuracy, completeness, or timeliness of the content and is not responsible for any actions taken based on the information provided. The content does not constitute financial, legal, or other professional advice, nor should it be considered a recommendation or endorsement by MEXC.

You May Also Like

Daily XRP transfer volume surpasses 500 million! What does this mean during the latest price drop?

Daily XRP transfer volume surpasses 500 million! What does this mean during the latest price drop?

🚨 Daily transfer volume in $XRP just topped 500 million XRP. 📈 Network usage fully rebounded after a big selloff while price is still weak. 🛡️ Over 145,000 users
Share
COINTURK EN2026/06/19 21:08
Ethereum koers toont zeldzaam dubbel koopsignaal en richt zich op $4.550

Ethereum koers toont zeldzaam dubbel koopsignaal en richt zich op $4.550

Connect met Like-minded Crypto Enthusiasts! Connect op Discord! Check onze Discord   Ethereum laat op de uurgrafiek twee opeenvolgende TD Sequential koopsignalen zien. Deze indicator meet uitputting in een trend en geeft vaak een signaal dat de verkoopdruk kan afnemen. Dit dubbele signaal verschijnt rond het niveau van $4.516, waar de ETH prijs kortstondig steun vindt. Dit type formatie komt zelden voor en wordt daarom extra nauwlettend gevolgd. Wat gaat de Ethereum koers hiermee doen? Ethereum koers test steun rond $4.516 De scherpe daling van de Ethereum koers vanaf de prijszone rond $4.800 bracht de ETH prijs in korte tijd naar ongeveer $4.516. Op dit niveau trad duidelijke koopactiviteit op, waardoor de neerwaartse beweging tijdelijk werd gestopt. Het dubbele signaal dat door de TD Sequential indicator is gegenereerd, viel precies samen met dit prijspunt. De TD Sequential is opgebouwd uit negen candles die een trend meetellen. Wanneer de negende candle verschijnt, kan dit duiden op een trendomslag. In dit geval verschenen zelfs twee signalen kort na elkaar, wat aangeeft dat de verkoopdruk mogelijk uitgeput is. Het feit dat dit gebeurde in een zone waar ETH kopers actief bleven, maakt het patroon extra opvallend. TD Sequential just flashed two buy signals for Ethereum $ETH! pic.twitter.com/JPO8EhiEPi — Ali (@ali_charts) September 16, 2025 Welke crypto nu kopen?Lees onze uitgebreide gids en leer welke crypto nu kopen verstandig kan zijn! Welke crypto nu kopen? Fed-voorzitter Jerome Powell heeft aangekondigd dat de rentes binnenkort zomaar eens omlaag zouden kunnen gaan, en tegelijkertijd blijft BlackRock volop crypto kopen, en dus lijkt de markt klaar om te gaan stijgen. Eén vraag komt telkens terug: welke crypto moet je nu kopen? In dit artikel bespreken we de munten die… Continue reading Ethereum koers toont zeldzaam dubbel koopsignaal en richt zich op $4.550 document.addEventListener('DOMContentLoaded', function() { var screenWidth = window.innerWidth; var excerpts = document.querySelectorAll('.lees-ook-description'); excerpts.forEach(function(description) { var excerpt = description.getAttribute('data-description'); var wordLimit = screenWidth wordLimit) { var trimmedDescription = excerpt.split(' ').slice(0, wordLimit).join(' ') + '...'; description.textContent = trimmedDescription; } }); }); Technische indicatoren schetsen herstelkans voor ETH Naast de dubbele koopsignalen verstrekken ook andere indicatoren belangrijke aanwijzingen. Tijdens de daling van de ETH koers waren grote rode candles zichtbaar, maar na de test van $4.516 stabiliseerde de Ethereum koers. Dit wijst op een mogelijke verschuiving in het evenwicht tussen de bears en bulls. Als deze opwaartse beweging doorzet, liggen de eerste weerstanden rond $4.550. Daarboven wacht een sterkere zone rond $4.650. Deze niveaus zijn in eerdere Ethereum sessies al meerdere keren getest. Een doorbraak zou ruimte openen richting de all-time high van ETH rond $4.953. Wanneer de prijs toch opnieuw onder $4.516 zakt, liggen er zones rond $4.500 en $4.450 waar grotere kooporders worden verwacht. Deze niveaus kunnen als een vangnet fungeren, mocht de druk opnieuw toenemen. Marktdynamiek bevestigt technische indicatoren De huidige situatie volgt op een bredere correctie in de cryptomarkt. Verschillende vooraanstaande crypto tokens zagen scherpe koersdalingen, waarna traders op zoek gingen naar signalen voor een mogelijke ommekeer. Dat juist Ethereum nu een dubbel TD Sequential signaal toont, versterkt de interesse in dit scenario. Fundamenteel blijft Ethereum sterk. Het aantal ETH tokens dat via staking is vastgezet, blijft groeien. Dat verkleint de vrije circulatie en vermindert verkoopdruk. Tegelijk blijft het netwerk intensief gebruikt voor DeFi, NFT’s en stablecoins. Deze activiteiten zorgen voor een stabiele vraag naar ETH, ook wanneer de prijs tijdelijk onder druk staat. Fundamentele drijfveren achter de Ethereum koers De Ethereum koers wordt echter niet alleen bepaald door candles en patronen, maar ook door bredere factoren. Een stijgend percentage van de totale ETH supply staat vast in staking contracten. Hierdoor neemt de liquiditeit op exchanges af. Dit kan prijsschommelingen versterken wanneer er plotseling meer koopdruk ontstaat. Daarnaast is Ethereum nog steeds het grootste smart contract platform. Nieuwe standaarden zoals ERC-8004 en ontwikkelingen rond layer-2 oplossingen houden de activiteit hoog. Deze technologische vooruitgang kan de waardepropositie ondersteunen en zo indirect bijdragen aan een ETH prijsherstel. Het belang van de korte termijn dynamiek De komende handelsdagen zullen duidelijk maken of de bulls genoeg kracht hebben om door de weerstandszone rond $4.550 te breken. Voor de bears ligt de focus juist op het verdedigen van de prijsregio rond $4.516. De whales, die met grote handelsorders opereren, kunnen hierin een beslissende rol spelen. Het dubbele TD Sequential signaal blijft hoe dan ook een zeldzame gebeurtenis. Voor cryptoanalisten vormt het een objectief aanknopingspunt om de kracht van de huidige Ethereum trend te toetsen. Vooruitblik op de ETH koers Ethereum liet twee opeenvolgende TD Sequential signalen zien op de uurgrafiek, iets wat zelden voorkomt. Deze formatie viel samen met steun rond $4.516, waar de bulls actief werden. Als de Ethereum koers boven dit niveau blijft, kan er ruimte ontstaan richting $4.550 en mogelijk $4.650. Zakt de prijs toch opnieuw onder $4.516, dan komen $4.500 en $4.450 in beeld als nieuwe steunzones. De combinatie van zeldzame indicatoren en een sterke fundamentele basis maakt Ethereum interessant voor zowel technische als fundamentele analyses. Of de bulls het momentum echt kunnen overnemen, zal blijken zodra de Ethereum koers de eerstvolgende weerstanden opnieuw test. Koop je crypto via Best Wallet Best wallet is een topklasse crypto wallet waarmee je anoniem crypto kan kopen. Met meer dan 60 chains gesupport kan je al je main crypto coins aanschaffen via Best Wallet. Best wallet - betrouwbare en anonieme wallet Best wallet - betrouwbare en anonieme wallet Meer dan 60 chains beschikbaar voor alle crypto Vroege toegang tot nieuwe projecten Hoge staking belongingen Lage transactiekosten Best wallet review Koop nu via Best Wallet Let op: cryptocurrency is een zeer volatiele en ongereguleerde investering. Doe je eigen onderzoek. Het bericht Ethereum koers toont zeldzaam dubbel koopsignaal en richt zich op $4.550 is geschreven door Dirk van Haaster en verscheen als eerst op Bitcoinmagazine.nl.
Share
Coinstats2025/09/17 23:31
UK Gilt Yields Spike As Burnham Win Opens Door To Oust Starmer

UK Gilt Yields Spike As Burnham Win Opens Door To Oust Starmer

UK Gilt Yields Spike As Burnham Win Opens Door To Oust Starmer The odds of embattled UK Prime Minister Keir Starmer being ousted by the end of July
Share
ZeroHedge2026/06/19 21:05

Score Your Share of 50K USDT

Score Your Share of 50K USDTScore Your Share of 50K USDT

Complete DEX+ tasks to unlock the Champion Wheel