

Berkshire Tripled Its Alphabet Stock Stake to $16.6B — Now What?
 GOOGL — daily chart with candlesticks, EMA20/EMA50 and volume.
Key takeaways
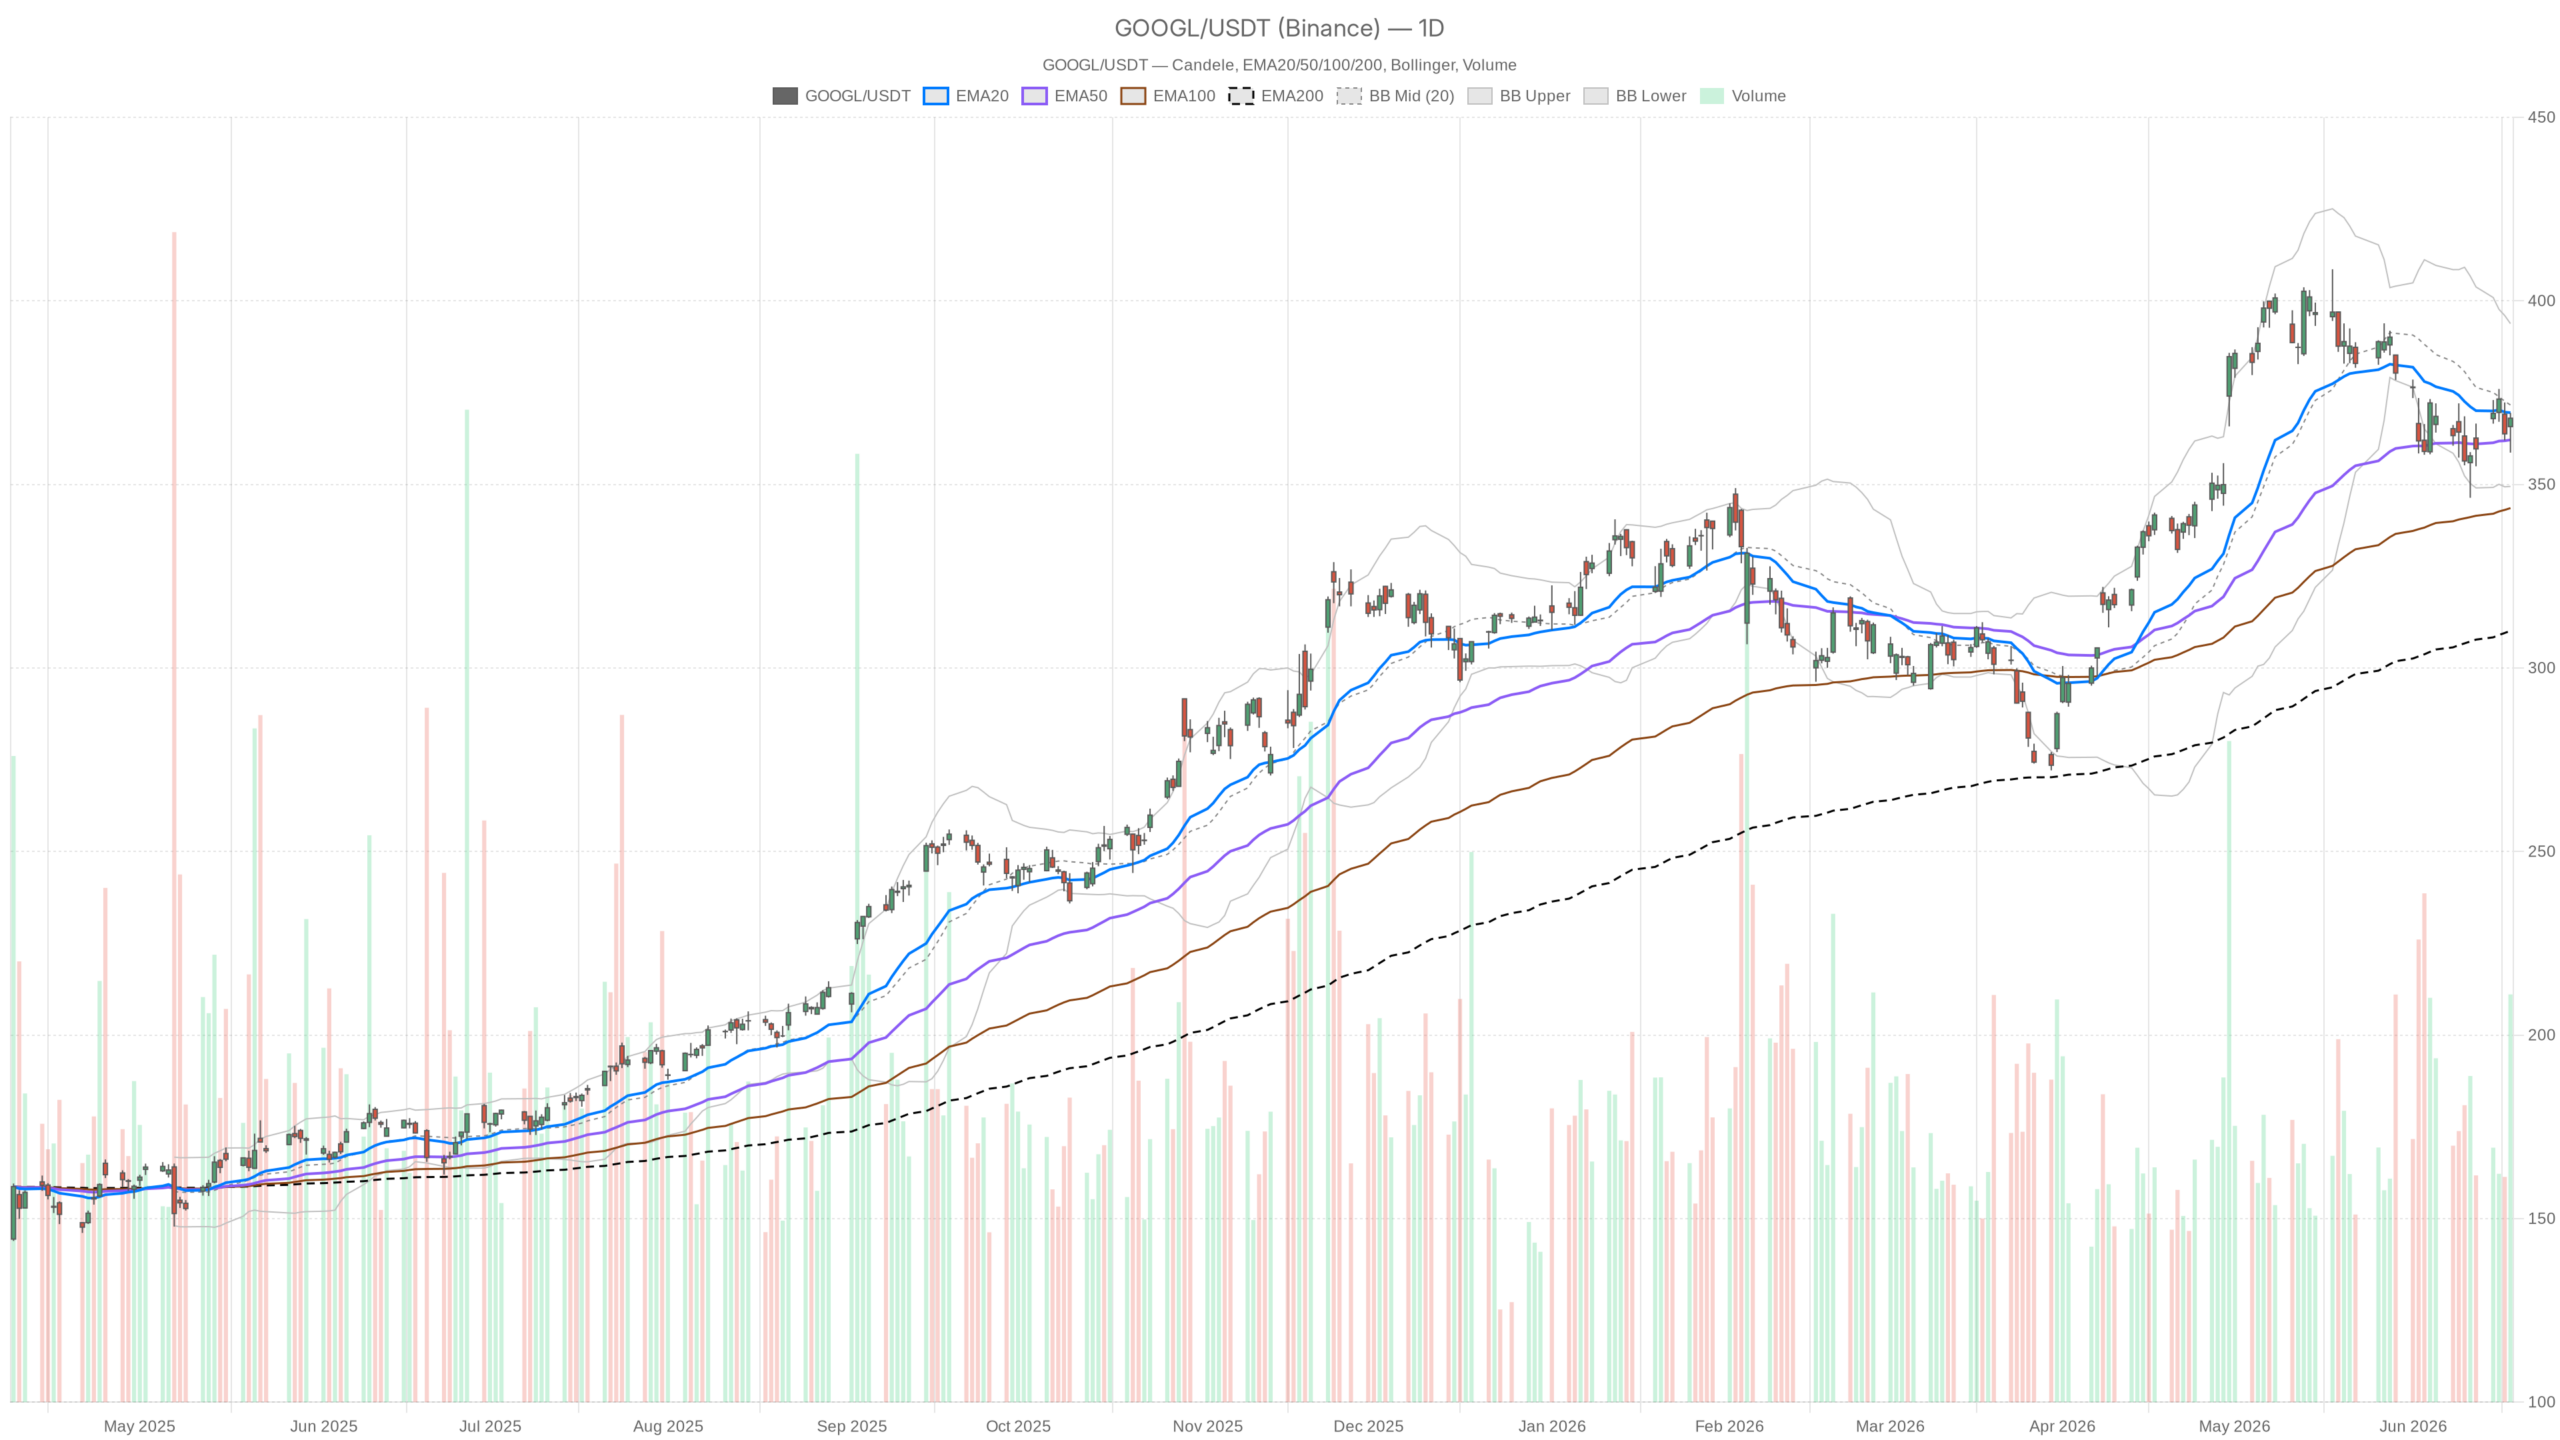
- GOOGL closed at $368.03 on June 18, sitting just below its 20-day EMA at $369.54 — keeping the daily bias neutral.
- The 50-day EMA at $362.13 and 200-day EMA at $310.12 remain supportive, confirming the long-term recovery trend for Alphabet stock.
- Daily MACD remains negative at -1.85 vs. signal at -0.73, arguing against chasing upside without confirmation.
- Berkshire Hathaway nearly tripled its stake in Q1 2026 to roughly 57.8 million shares, signaling deep institutional conviction.
- A break above the $369.54–$372.12 resistance cluster is the key bullish trigger; failure risks a slide toward daily S1 support at $361.31.
Alphabet stock is neither breaking out nor breaking down — but the tension beneath the surface is building. GOOGL closed at $368.03 on June 18, sitting just below its 20-day EMA. The daily chart signals genuine indecision, yet shorter timeframes suggest bulls are quietly regaining ground.
Daily Chart: A Neutral Regime With Support Beneath
The daily chart for Alphabet stock remains firmly neutral but structurally supported. Price holds above both the 50-day and 200-day EMAs. However, the 20-day EMA at $369.54 sits just above the close, acting as immediate resistance.
EMA Structure: Long-Term Support, Near-Term Resistance
The EMA structure offers one clear positive. GOOGL trades above the 50-day EMA at $362.13 and the 200-day EMA at $310.12. That wide gap tells a powerful story — Alphabet stock has fully recovered from its 2025 lows. Still, the 20-day EMA at $369.54 sits just above the current close. That proximity matters. Bulls have not confirmed control at this level yet.
Momentum Indicators Confirm Indecision
Meanwhile, the daily RSI at 49.1 sits just below the midpoint with no momentum lean. The MACD line at -1.85 remains below its signal line at -0.73. The negative histogram of -1.12 confirms selling momentum has been in play. This is not a collapsing setup — but it is a softening one. The MACD configuration alone argues against chasing upside without clear confirmation.
Bollinger Bands and Pivot Levels
In terms of volatility, Bollinger Bands place price near the midline at $371.63. The upper band sits at $393.80 and the lower band at $349.46. The spread is moderately wide, reflecting the ATR of $11.48. Price hugging the middle band reinforces the neutral thesis. Neither bulls nor bears have asserted directional dominance at this stage.
The daily pivot point sits at $365.39, with resistance at $372.12 and support at $361.31. GOOGL’s close at $368.03 places it above the daily pivot — a mildly constructive sign. A sustained move above $372.12 would shift the near-term tone more decisively bullish.
Hourly Chart: A Constructive Lean Without Commitment
The hourly chart offers a more encouraging picture for Alphabet stock, though the regime remains neutral. The short-term EMA stack is supportive, yet overhead resistance keeps the trend from fully flipping positive.
Price at $367.99 trades above both the 20-hour EMA at $366.61 and the 50-hour EMA at $366.15. This creates a bullish short-term stack. In contrast, the 200-hour EMA at $370.46 remains overhead. That level must be reclaimed for the intraday trend to fully turn positive. The gap is roughly two dollars away — not insurmountable in ATR terms within a strong session.
The 1H RSI at 53.63 nudges into mildly bullish territory, a notable improvement from the daily reading. At the same time, the 1H MACD is essentially flat. The line and signal are both at 0.24, with a histogram reading of -0.01. This near-zero histogram tells you the hourly momentum battle is live and unresolved. The slight upward lean in RSI keeps bulls in the conversation.
15-Minute Chart: The Only Bullish Timeframe
Meanwhile, the 15-minute chart is the only timeframe carrying a bullish classification for GOOGL. RSI at 57.31 supports mild upward pressure. The MACD histogram on this timeframe is positive at 0.13. Price trades above all three short-term EMAs, confirming the constructive intraday structure.
Notably, the 15m Bollinger upper band sits at $369.71. This aligns closely with key resistance at $369.64, identified across both the 1H and 15m pivot structures. Therefore, a clean break above $369.71 on the 15-minute chart with volume would represent a credible short-term bullish trigger. Until that level clears, intraday structure remains constructive but unconfirmed.
Fundamental Catalysts: Berkshire and AI Infrastructure
The fundamental backdrop for Alphabet stock is notably supportive. Two major developments — Berkshire Hathaway’s expanded stake and Alphabet’s AI infrastructure investment — anchor the bullish long-term thesis.
Berkshire Hathaway, under Greg Abel’s operational leadership, nearly tripled its Alphabet stake in Q1 2026. The position now stands at roughly 57.8 million shares, valued at approximately $16.6 billion. That move vaults Alphabet into a top-five Berkshire holding. Institutional conviction of this magnitude signals a long-duration view on Alphabet’s earnings power and AI positioning.
On top of that, Alphabet announced a $1.5 billion investment across 2026 and 2027 to expand its Alabama data center campus. This capital commitment speaks directly to long-term capacity in cloud and AI. The market has clearly rewarded such themes, given that GOOGL shares are up roughly 108% over the past year.
Emerging Headwinds for Alphabet Stock
However, not all the news is supportive. Two operational developments deserve scrutiny. Waymo, Alphabet’s self-driving subsidiary, is recalling nearly 4,000 robotaxis in the US. The recall addresses software that could allow vehicles to enter closed freeway construction zones at speed. While manageable in isolation, it represents reputational and regulatory risk for one of Alphabet’s highest-profile moonshot bets.
More notable, perhaps, is the departure of Noam Shazeer — a key architect of the Gemini AI model. He is leaving to join OpenAI. Losing senior AI leadership to a direct competitor at this stage is not a trivial event. It raises questions about retention and culture within Google DeepMind at a critical juncture.
Bullish Scenario: What Needs to Happen
Alphabet stock can turn decisively bullish if it clears the $369.54–$372.12 resistance cluster. Improving MACD momentum on the hourly chart would provide the needed confirmation. The bullish scenario rests on several reinforcing factors that could align over the coming sessions.
Add the Berkshire institutional endorsement and AI infrastructure investment as fundamental tailwinds. The setup for a push toward the upper Bollinger Band at $393.80 becomes credible over a multi-week horizon. The 200-day EMA at $310.12 sits far below current price. This provides a long-term floor that removes existential downside risk from the equation.
Bearish Case: The Risks to Monitor
The bearish case, on the other hand, centers on the daily MACD remaining negative. If GOOGL fails to reclaim the 20-day EMA, the neutral regime could deteriorate. A slip below the daily pivot at $365.39 would confirm the shift. A test of support at $361.31 would then put the 50-day EMA at $362.13 under pressure. That would materially weaken the near-term bullish narrative.
The Waymo recall and the Shazeer exit, while not immediately catastrophic, create headline risk that could weigh on sentiment. A break below daily S1 at $361.31 would open the door to deeper selling. Bears would then target the lower Bollinger Band near $349.46.
Final Assessment: Respecting Both Sides
Overall, Alphabet stock sits in a technically balanced but fundamentally loaded position. The daily bias is neutral. The hourly structure leans constructively without committing. Only the 15-minute chart registers as outright bullish.
Traders navigating GOOGL must respect the overhead resistance cluster between $369.54 and $372.12. They must also respect the institutional gravity pulling from below. With a daily ATR above $11, volatility is real and position sizing matters. The next directional catalyst will likely come from a macro shift or a re-rating of Alphabet’s AI narrative. Given the current news cycle, that catalyst could arrive at any moment.
FAQ
Is Alphabet stock bullish or bearish right now?
The daily bias for Alphabet stock is neutral. Price sits above the 50-day and 200-day EMAs but below the 20-day EMA at $369.54. The daily MACD remains negative, while the 15-minute chart is the only timeframe showing a bullish classification. A confirmed break above $372.12 would shift the bias more decisively bullish.
What are the key resistance levels for GOOGL?
The immediate resistance cluster sits between the 20-day EMA at $369.54 and the daily R1 pivot at $372.12. Above that, the Bollinger upper band at $393.80 represents the next major upside target. The 200-hour EMA at $370.46 also acts as intraday resistance.
What is Berkshire Hathaway’s position in Alphabet?
Berkshire Hathaway nearly tripled its Alphabet stake in Q1 2026 to roughly 57.8 million shares, valued at approximately $16.6 billion. This places Alphabet among Berkshire’s top-five holdings and signals strong institutional conviction in the company’s long-term earnings power and AI positioning.
What support levels should traders watch?
The daily pivot at $365.39 is the first level to watch. Below that, daily S1 support sits at $361.31, followed closely by the 50-day EMA at $362.13. A break below this zone would weaken the bullish narrative. The lower Bollinger Band at $349.46 and the 200-day EMA at $310.12 offer deeper structural support.
Disclaimer: This article is for informational purposes only and does not constitute financial advice, an investment recommendation, or a solicitation to buy or sell any financial instrument or cryptocurrency. The analysis provided is not indicative of future results. Investing in crypto assets and financial markets carries a high risk of capital loss. Always do your own research (DYOR) and consult a qualified financial advisor before making any decision.
Article produced with the assistance of artificial intelligence and reviewed by the editorial team.


You May Also Like

Daily XRP transfer volume surpasses 500 million! What does this mean during the latest price drop?

Ethereum koers toont zeldzaam dubbel koopsignaal en richt zich op $4.550

UK Gilt Yields Spike As Burnham Win Opens Door To Oust Starmer


