

Ethereum Price Prediction: ETH Price Stalls, but On-Chain Data Tells a Different Story
Key highlights:
- The ETH price is defending the $1,550-$1,650 support zone as traders watch for the next major move.
- Ethereum processes over 2M daily transactions with 420K+ active addresses.
- Institutional ETF developments and upcoming network upgrades are strengthening Ethereum’s long-term outlook.
Ethereum trades in a significant range for this year, as there are conflicting views about the next possible move. The ETH price stays trapped within a wider downtrend pattern, while the network is active and processes millions of transactions and thousands of addresses daily.
This situation has attracted the attention of traders and analysts. Crypto Patel sees Ethereum trading inside an important accumulation range. He identifies $1,200-$1,600 as the best place for purchases and mentions $4,700 as the potential breakout point in case of a new bull cycle.
In his roadmap, he even has targets of $10,000, $15,000, and $20,000. Currently, the focus is on a more immediate area. The ETH price tries to defend the support level of $1,550-$1,650.
Analyst sees Ethereum as an accumulation opportunity
Crypto Patel's broader view focuses less on short-term volatility and more on longer market cycles.
His accumulation map identifies the $1,600-$1,200 region as the strongest buying zone for Ethereum. That's exactly where the ETH price is trading today, making this support area especially important for investors following that thesis.
Another point which Patel indicates is the $4,700 resistance level. In order for Ethereum to reach much higher price levels such as $10,000, $15,000, and $20,000, it must first surpass the $4,700 resistance level. These are targets far beyond the current levels but would require a reversal of Ethereum’s long-term trend.
Ethereum is testing a critical support area
We had a look at Ethereum's daily chart, and the structure remains under pressure. ETH is currently trading around $1,694, which is significantly lower than its 100-day simple moving average of $2,108.58, while lower highs and lows represent the larger ETH price trend from its 2025 high.
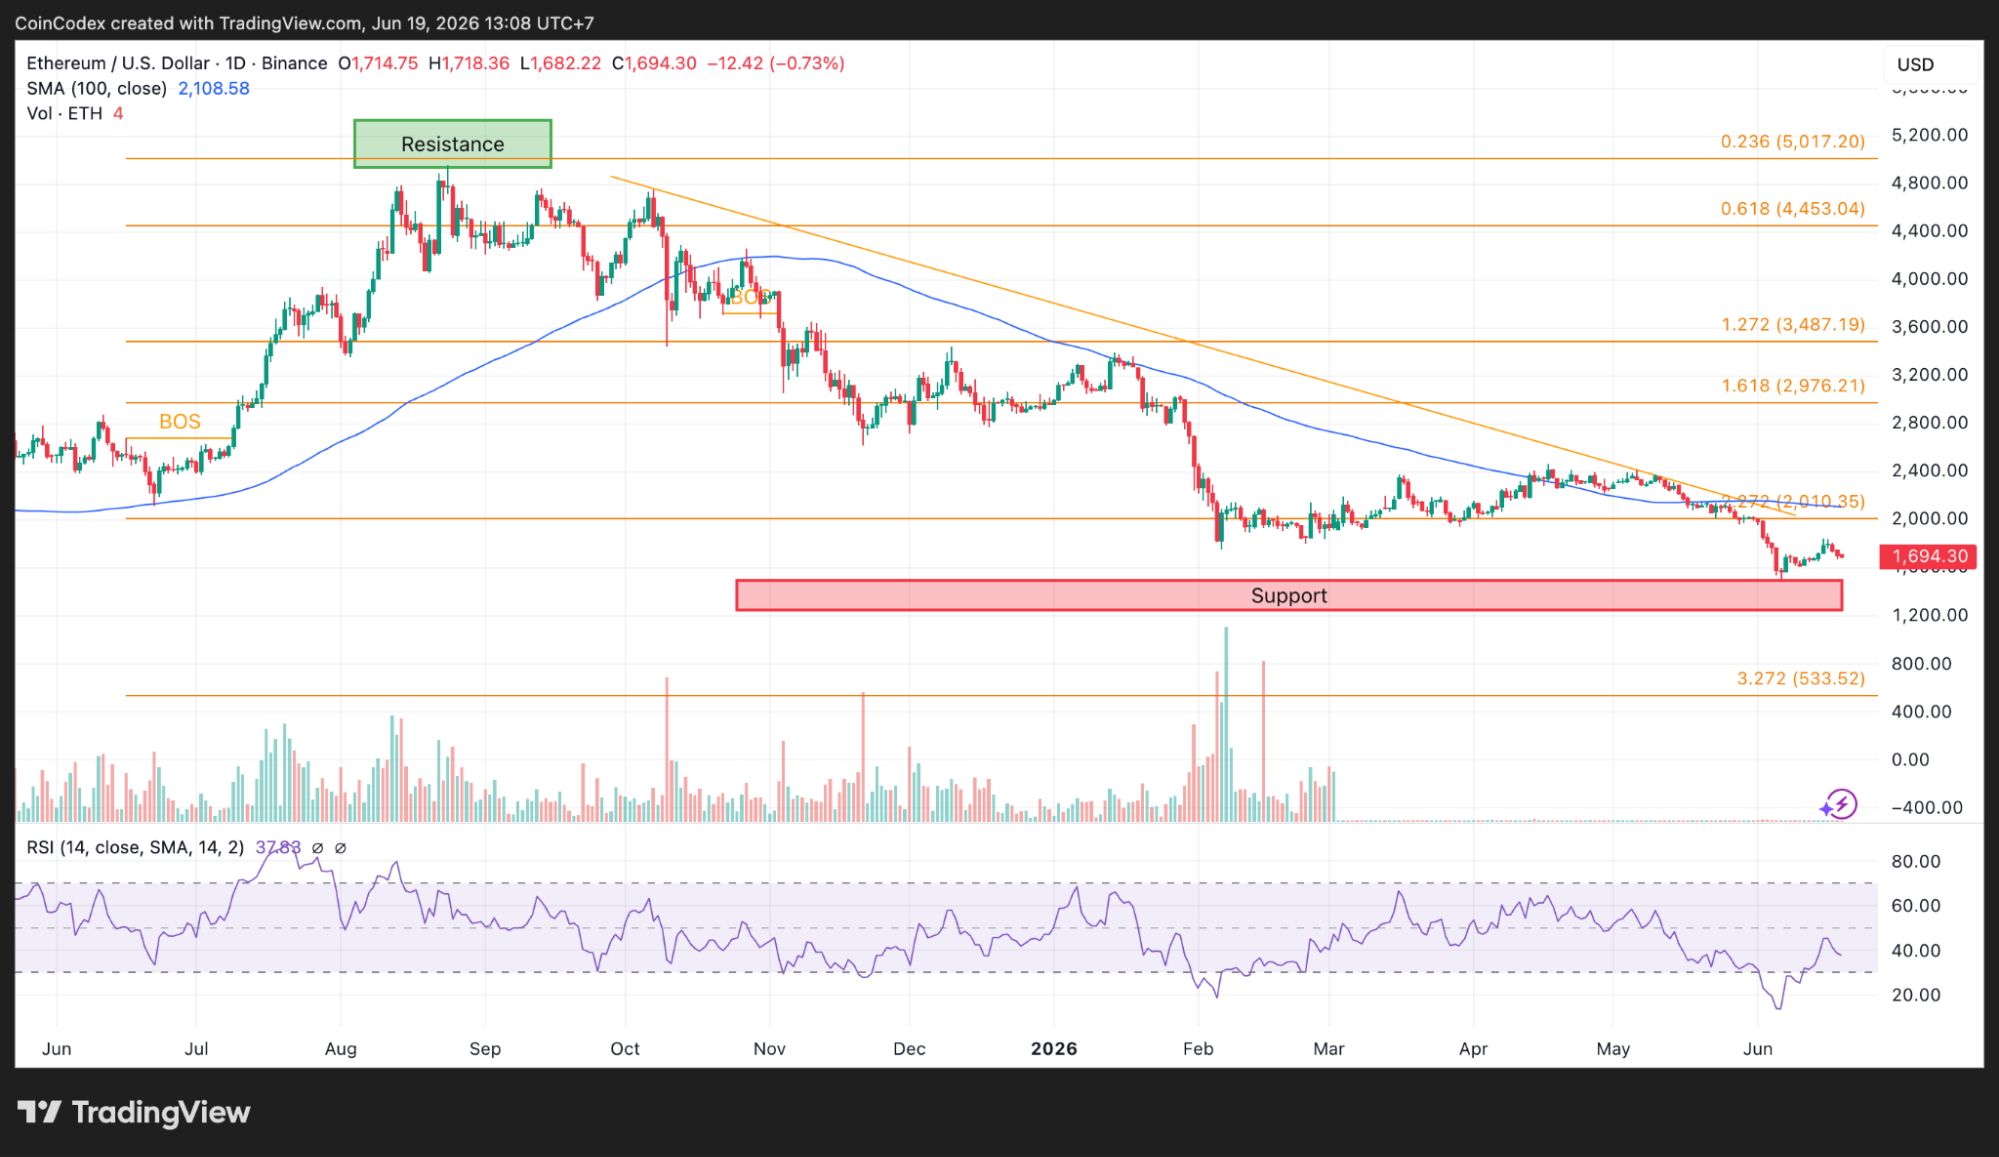
Daily ETH chart analysis
Most likely, the most significant technical factor that will impact the ETH price is the horizontal support range from $1,550 to $1,650 because this price area has already witnessed buying interest, keeping the asset from further declines.
Momentum is also low. The daily RSI indicator is at 37.88, meaning that Ethereum is not far from being considered oversold territory, without falling into extremes yet. A breakout of support could bring deeper Fibonacci extension levels, whereas the defense of support will bring back resistance between $1,900 and $2,000.
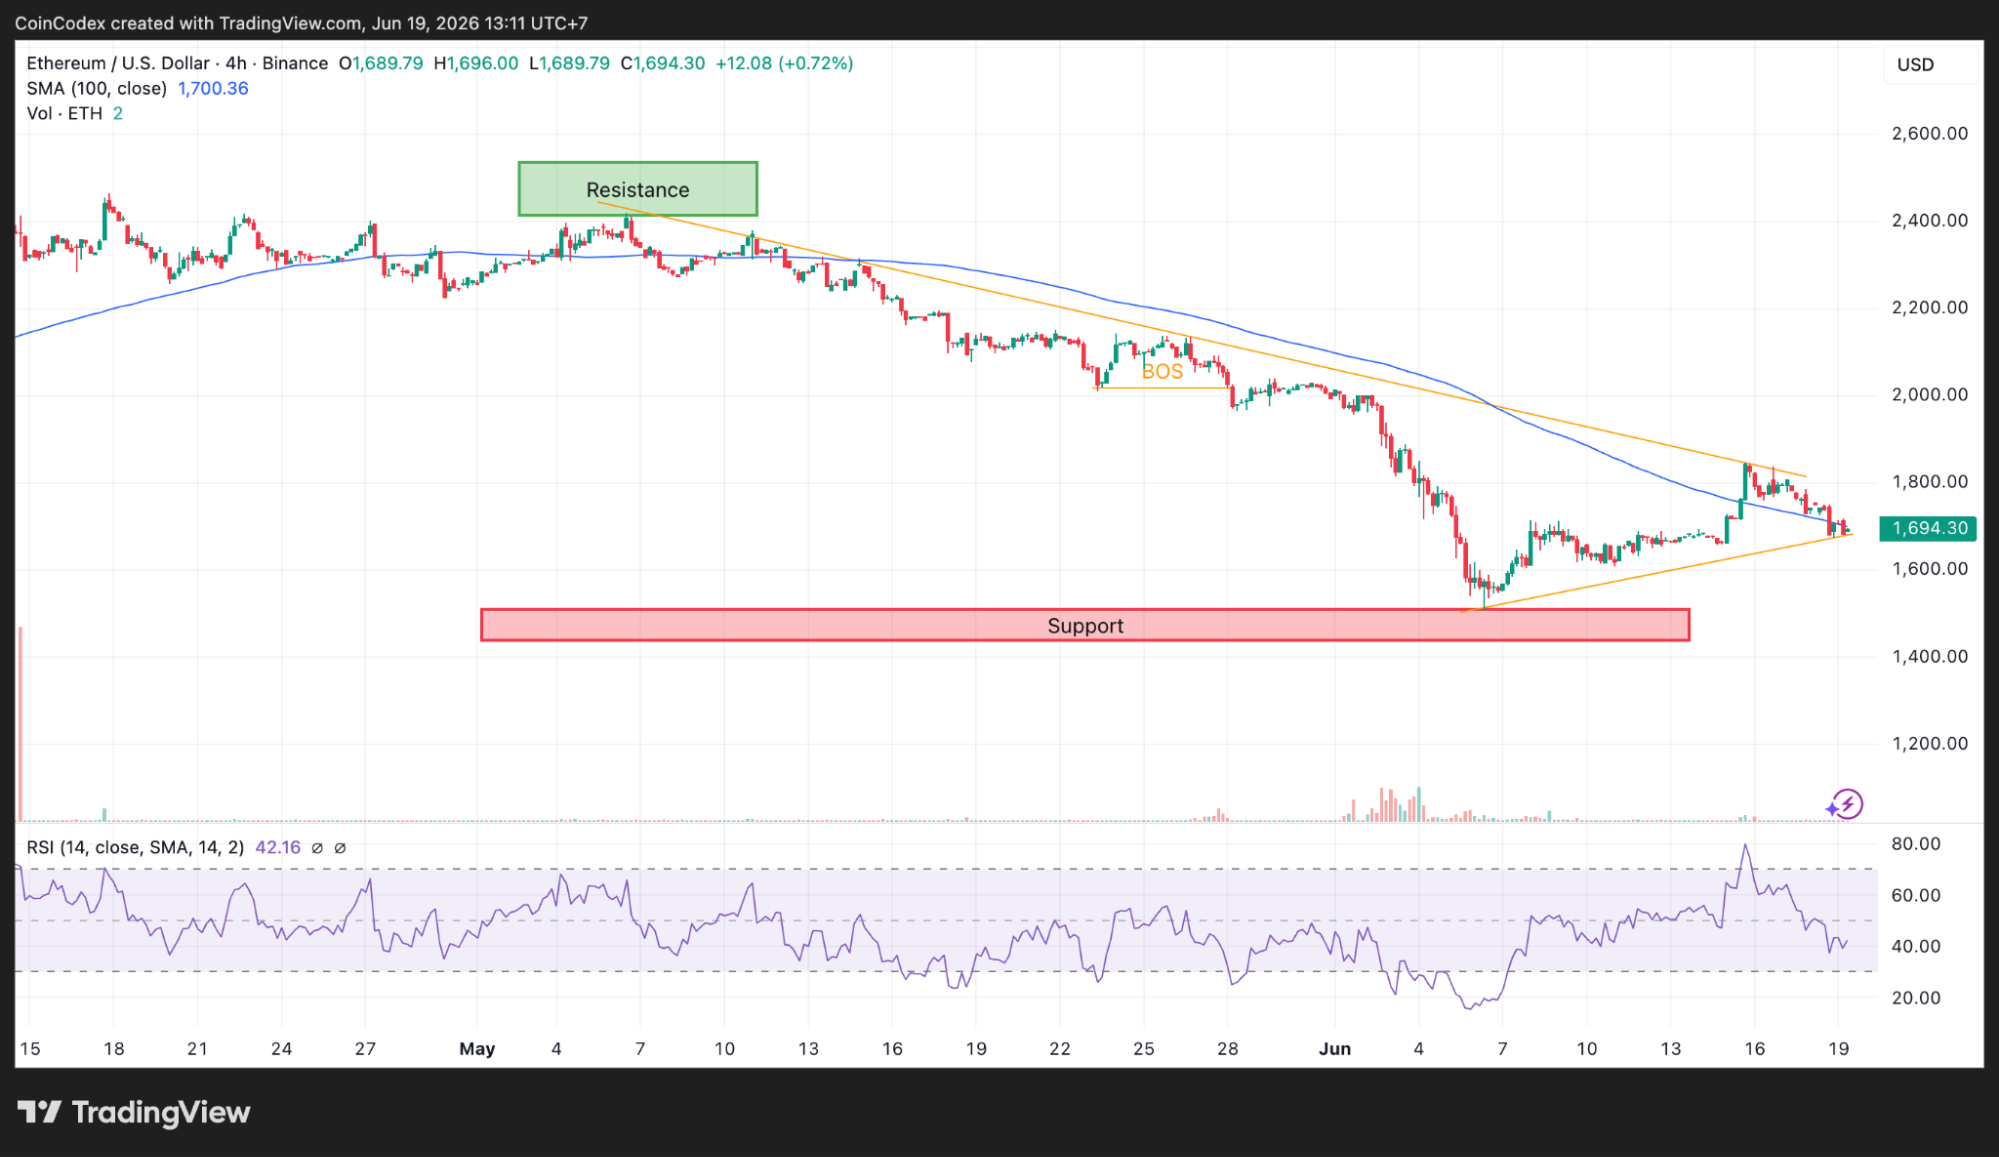
4-Hour ETH chart analysis
In addition, the 4-hour chart provides a more or less similar picture. The ETH price is currently trading below the 100 simple moving average of $1,700.36, following rejection from the same support level. The 4-hour RSI indicator is near 42.16.
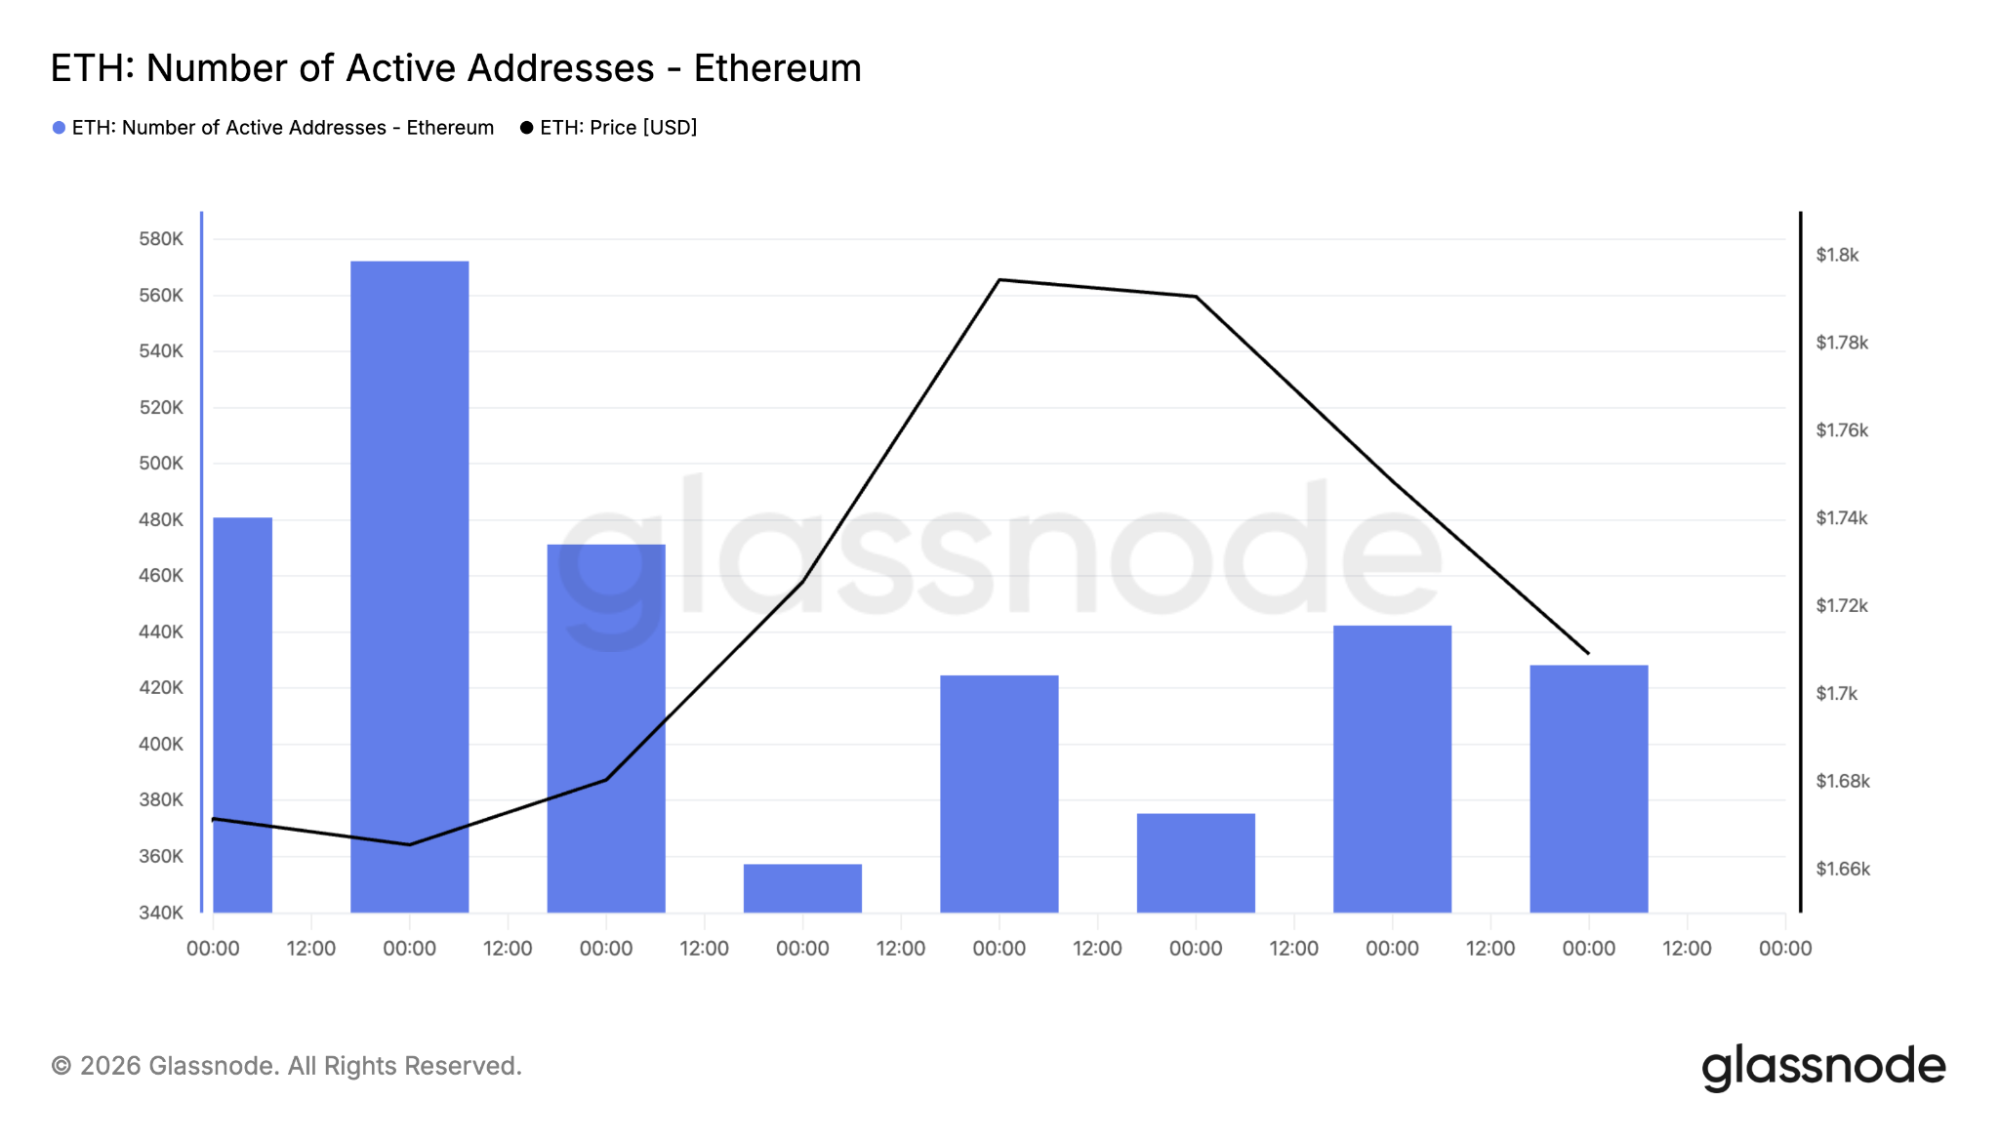
ETH network activity stayed strong despite price weakness
Active addresses range from 340,000 to 570,000 based on Glassnode statistics. The number of active addresses rose to approximately 570,000 before cooling off, and currently stands at about 420,000 to 430,000.
Transaction counts tell a similar story. Ethereum processed between 1.8 million and 2.55 million transactions across the same period, with the latest reading staying close to 2.1 million transactions.
What's interesting is that usage stayed elevated even after the ETH price pulled back from nearly $1,800 to around $1,710. That means network participation didn't disappear alongside price weakness, a pattern many investors monitor when looking for potential accumulation phases.
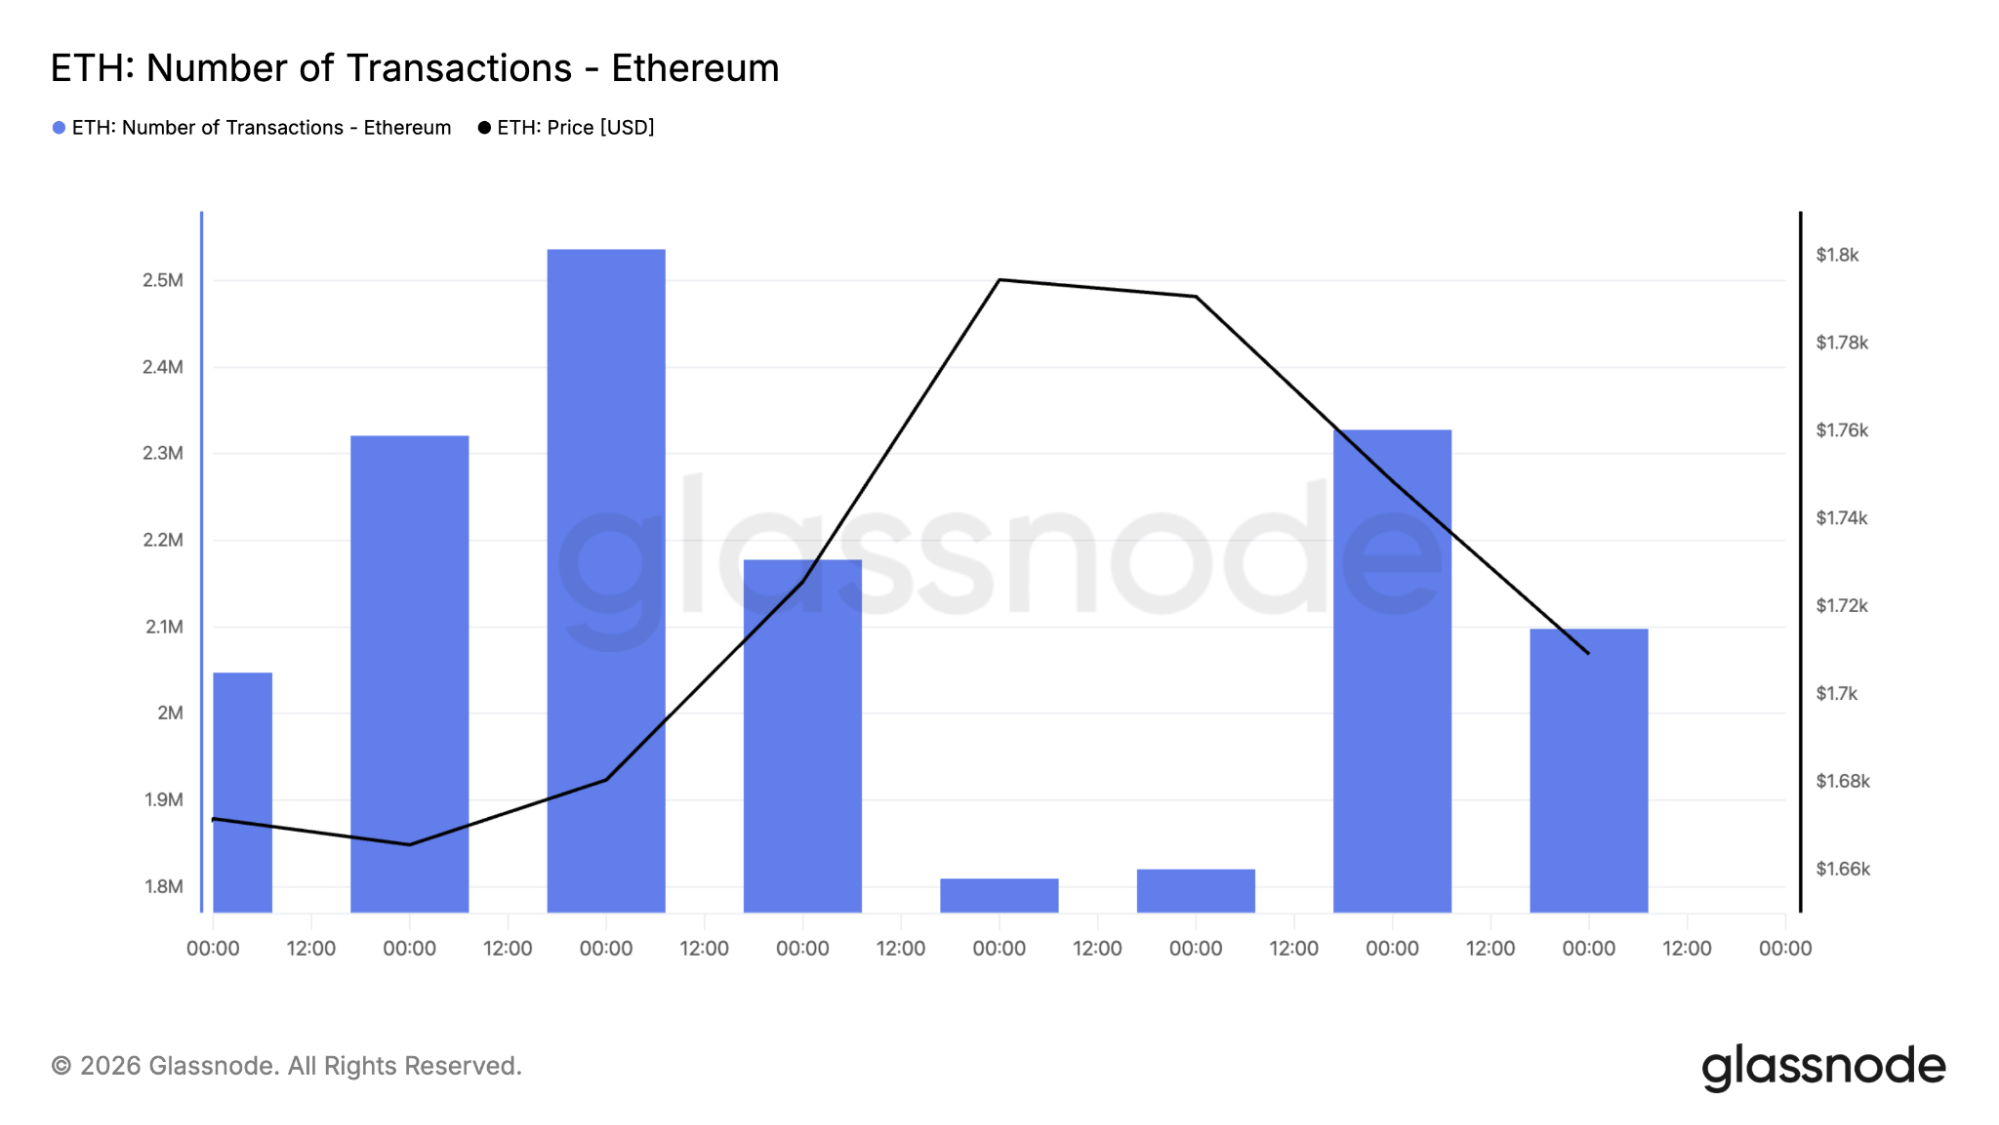
The combination of more than 420,000 active addresses and over 2 million daily transactions points to continued demand for Ethereum's ecosystem through transfers, decentralized finance applications, and smart contract activity.
Institutional products and network upgrades continue expanding
The fundamental picture continues evolving even though the ETH price remains below major moving averages. Ethereum's development roadmap includes the Glamsterdam hard fork, planned for the first half of 2026.
The upgrade aims to increase Layer 1 throughput by pushing the gas limit toward and beyond 100 million while introducing enshrined Proposer-Builder Separation (ePBS). Later in 2026, the Hegotá upgrade is expected to introduce Verkle Trees, another step toward stateless clients and higher scalability.
Institutional products are also expanding. Spot Ethereum ETFs already provide regulated exposure, and Morgan Stanley amended its Ethereum ETF filing on June 18, 2026, to include a staking structure that keeps 95% of staking rewards inside the trust.
Products like these can reduce circulating supply by locking ETH into investment vehicles and staking programs, creating another source of demand beyond retail trading.
What could be next for the ETH price?
The ETH price remains trapped between improving fundamentals and a bearish technical structure. Levels ranging from $1,550 to $1,650 have been holding up, there are more than 420,000 active addresses, and the number of transactions has stayed consistent at 2.1 million.
Meanwhile, Ethereum is trading below its daily and shorter-term moving averages and thus showing that resistance remains intact. Should bulls take control of the $1,700 area and take out $1,850-$1,900, the next objective might be seen closer to the $2,010 Fibonacci point and ultimately the daily 100 SMA of $2,108.
If support fails, the correction could extend toward lower Fibonacci extensions and psychological support levels. For now, the ETH price remains at a crossroads. According to CoinCodex’s 1-month ETH price prediction, the price could move toward $1,973.82, pointing to potential upside from the current level.


You May Also Like

Ethereum koers toont zeldzaam dubbel koopsignaal en richt zich op $4.550

HashKey Capital’s Strategic $540K STO Deposit to Binance Reveals Institutional Crypto Moves Amid Market Turmoil
Mantra Native Support: Unlocking Brilliant Interoperability with EVM and CosmWasm


