Polkadot has become crypto’s top trending asset across social media. But the attention is not coming from overwhelming optimism. Much of the discussion is drivenPolkadot has become crypto’s top trending asset across social media. But the attention is not coming from overwhelming optimism. Much of the discussion is driven

Polkadot vs. Solana and Sui: Bearish Narrative Dominates as DOT Questions Its Long‑Term Relevance

2026/06/19 16:45
4 min read
For feedback or concerns regarding this content, please contact us at crypto.news@mexc.com

Polkadot has become crypto’s top trending asset across social media. But the attention is not coming from overwhelming optimism. Much of the discussion is driven by growing debate over DOT’s long‑term relevance.

Traders are questioning whether Polkadot’s strong technology and developer ecosystem can finally translate into meaningful user growth and price performance. Years of lagging behind competitors like Solana and Sui have created a surge in skepticism. Sentiment has dropped to one of its weakest levels in recent months, even as discussion volume explodes.

At the same time, DOT price sits near $0.95 – down over 75% from its 2021 highs. The chart looks broken. The narrative is bearish. But some analysts see the setup differently.

Santiment Report: High Attention, Low Confidence

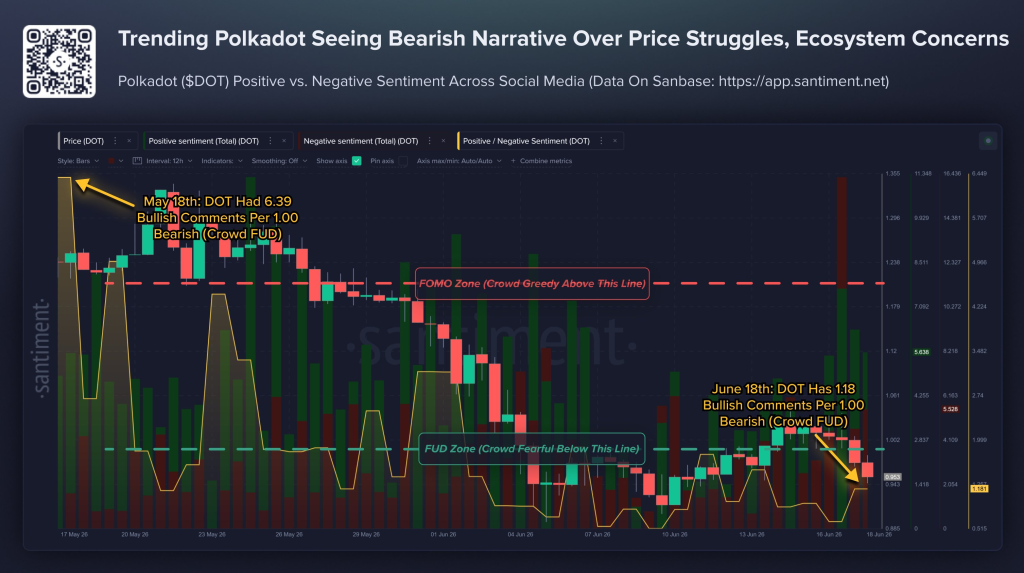
Santiment’s latest report highlights the paradox. Polkadot is the top trending asset, but the sentiment ratio has collapsed. On May 18, DOT had 6.39 bullish comments per 1 bearish post – firmly in the FOMO zone, meaning the crowd was greedy. As of June 18, that ratio has plunged to just 1.18 bullish comments per 1 bearish post – now in the FUD zone, below the line where crowd fear dominates.

The chart attached to Santiment’s report shows this drop clearly. The green line (sentiment ratio) fell off a cliff from early May to mid‑June. The red FUD zone line marks the threshold below which the crowd is considered fearful. DOT is now deep in that zone.

Source: X/@SantimentData

What is driving this shift? The community is actively debating developer activity, ecosystem adoption, governance decisions, tokenomics, and Polkadot’s upcoming technological roadmap. The sheer amount of conversation suggests investors are paying closer attention than they have in quite some time.

Santiment makes an important point. Historically, assets that become the center of intense bearish narratives often warrant monitoring closely, particularly when fear begins to outweigh fundamentals. Some of crypto’s most important turning points occur when attention is high but confidence is low.

Read also: Bitcoin Price News: BTC Price Pulls

TradingView Chart Analysis: DOT at 2023 Lows

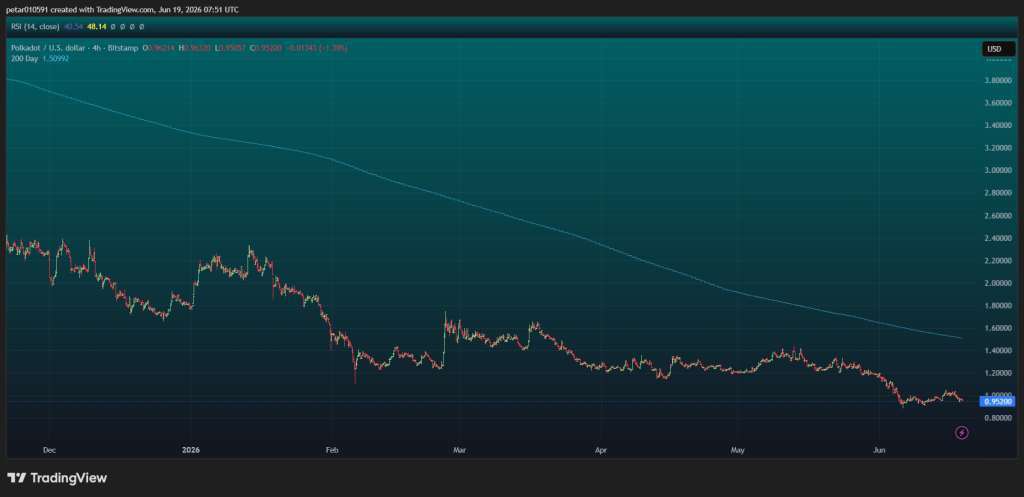
The 4‑hour chart from TradingView shows Polkadot/USD on Bitstamp as of June 19, 2026. The price sits at $0.952, down 1.39% in the session.

The most striking feature is the 200‑day moving average sitting at $1.509. That is roughly 58% above the current price. DOT has not traded above its 200‑day MA since late April. That is a classic sign of a bear market. Until price reclaims the 200‑day MA, the trend remains firmly downward.

Source: TradingView

The longer‑term view shows the full extent of the decline. DOT traded above $3.80 in late 2025. From there, it fell to $2.80, then $2.00, then $1.40, and now below $1.00. Each rally attempt has failed. Lower highs and lower lows are the pattern.

The RSI on the 4‑hour chart reads 40.54. That is neutral to bearish. It is not oversold, meaning there is room for further downside before a technical bounce becomes likely. The previous RSI reading of 48.14 shows that momentum has been weakening.

Key levels to watch:

  • Immediate resistance: $1.00 (psychological) and $1.05 (recent high)
  • Major resistance: $1.20 and the 200‑day MA at $1.509
  • Support: $0.91 (recent low), then $0.80 (2023 lows)
  • If $0.80 breaks, the next level is $0.65

Price Prediction for Polkadot

Below are our current Polkadot’s price predictions:

Bullish scenario: If DOT holds $0.91 and reclaims $1.00 with volume, a relief bounce to $1.05‑$1.10 is possible. A break above $1.20 would open the door to $1.40. But that requires a shift in sentiment and a broader altcoin recovery.

Neutral scenario: DOT consolidates between $0.91 and $1.00. Low volume. No clear direction. Traders wait for a catalyst.

Bearish scenario: A break below $0.91 opens the door to $0.80. Below that, $0.65 is the next major support from 2023. The bearish narrative would accelerate.

Our Take

Polkadot is in a tough spot. The technology is strong. The developer ecosystem is active. But the market does not care about technology right now. It cares about price, adoption, and momentum.

Solana and Sui are winning the battle for attention and capital. DOT has not kept up. The sentiment drop is justified based on price performance.

However, Santiment’s point is worth considering. Extreme bearish sentiment often precedes turning points. DOT is now in FUD territory. The crowd is fearful. Historically, that has sometimes marked bottoms – not always, but enough to pay attention.

For now, I would wait for a break above $1.00 before considering a position. The risk of another leg down to $0.80 is real. Patience is the edge here.

Subscribe to our YouTube channel for daily crypto updates, market insights, and expert analysis.

The post Polkadot vs. Solana and Sui: Bearish Narrative Dominates as DOT Questions Its Long‑Term Relevance appeared first on CaptainAltcoin.

World Cup Combo: Aim for 200x

World Cup Combo: Aim for 200xWorld Cup Combo: Aim for 200x

Combine up to 20 World Cup matches in one order

Disclaimer: The articles reposted on this site are sourced from public platforms and are provided for informational purposes only. They do not necessarily reflect the views of MEXC. All rights remain with the original authors. If you believe any content infringes on third-party rights, please contact crypto.news@mexc.com for removal. MEXC makes no guarantees regarding the accuracy, completeness, or timeliness of the content and is not responsible for any actions taken based on the information provided. The content does not constitute financial, legal, or other professional advice, nor should it be considered a recommendation or endorsement by MEXC.

You May Also Like

Daily XRP transfer volume surpasses 500 million! What does this mean during the latest price drop?

Daily XRP transfer volume surpasses 500 million! What does this mean during the latest price drop?

🚨 Daily transfer volume in $XRP just topped 500 million XRP. 📈 Network usage fully rebounded after a big selloff while price is still weak. 🛡️ Over 145,000 users
Share
COINTURK EN2026/06/19 21:08
Ethereum koers toont zeldzaam dubbel koopsignaal en richt zich op $4.550

Ethereum koers toont zeldzaam dubbel koopsignaal en richt zich op $4.550

Connect met Like-minded Crypto Enthusiasts! Connect op Discord! Check onze Discord   Ethereum laat op de uurgrafiek twee opeenvolgende TD Sequential koopsignalen zien. Deze indicator meet uitputting in een trend en geeft vaak een signaal dat de verkoopdruk kan afnemen. Dit dubbele signaal verschijnt rond het niveau van $4.516, waar de ETH prijs kortstondig steun vindt. Dit type formatie komt zelden voor en wordt daarom extra nauwlettend gevolgd. Wat gaat de Ethereum koers hiermee doen? Ethereum koers test steun rond $4.516 De scherpe daling van de Ethereum koers vanaf de prijszone rond $4.800 bracht de ETH prijs in korte tijd naar ongeveer $4.516. Op dit niveau trad duidelijke koopactiviteit op, waardoor de neerwaartse beweging tijdelijk werd gestopt. Het dubbele signaal dat door de TD Sequential indicator is gegenereerd, viel precies samen met dit prijspunt. De TD Sequential is opgebouwd uit negen candles die een trend meetellen. Wanneer de negende candle verschijnt, kan dit duiden op een trendomslag. In dit geval verschenen zelfs twee signalen kort na elkaar, wat aangeeft dat de verkoopdruk mogelijk uitgeput is. Het feit dat dit gebeurde in een zone waar ETH kopers actief bleven, maakt het patroon extra opvallend. TD Sequential just flashed two buy signals for Ethereum $ETH! pic.twitter.com/JPO8EhiEPi — Ali (@ali_charts) September 16, 2025 Welke crypto nu kopen?Lees onze uitgebreide gids en leer welke crypto nu kopen verstandig kan zijn! Welke crypto nu kopen? Fed-voorzitter Jerome Powell heeft aangekondigd dat de rentes binnenkort zomaar eens omlaag zouden kunnen gaan, en tegelijkertijd blijft BlackRock volop crypto kopen, en dus lijkt de markt klaar om te gaan stijgen. Eén vraag komt telkens terug: welke crypto moet je nu kopen? In dit artikel bespreken we de munten die… Continue reading Ethereum koers toont zeldzaam dubbel koopsignaal en richt zich op $4.550 document.addEventListener('DOMContentLoaded', function() { var screenWidth = window.innerWidth; var excerpts = document.querySelectorAll('.lees-ook-description'); excerpts.forEach(function(description) { var excerpt = description.getAttribute('data-description'); var wordLimit = screenWidth wordLimit) { var trimmedDescription = excerpt.split(' ').slice(0, wordLimit).join(' ') + '...'; description.textContent = trimmedDescription; } }); }); Technische indicatoren schetsen herstelkans voor ETH Naast de dubbele koopsignalen verstrekken ook andere indicatoren belangrijke aanwijzingen. Tijdens de daling van de ETH koers waren grote rode candles zichtbaar, maar na de test van $4.516 stabiliseerde de Ethereum koers. Dit wijst op een mogelijke verschuiving in het evenwicht tussen de bears en bulls. Als deze opwaartse beweging doorzet, liggen de eerste weerstanden rond $4.550. Daarboven wacht een sterkere zone rond $4.650. Deze niveaus zijn in eerdere Ethereum sessies al meerdere keren getest. Een doorbraak zou ruimte openen richting de all-time high van ETH rond $4.953. Wanneer de prijs toch opnieuw onder $4.516 zakt, liggen er zones rond $4.500 en $4.450 waar grotere kooporders worden verwacht. Deze niveaus kunnen als een vangnet fungeren, mocht de druk opnieuw toenemen. Marktdynamiek bevestigt technische indicatoren De huidige situatie volgt op een bredere correctie in de cryptomarkt. Verschillende vooraanstaande crypto tokens zagen scherpe koersdalingen, waarna traders op zoek gingen naar signalen voor een mogelijke ommekeer. Dat juist Ethereum nu een dubbel TD Sequential signaal toont, versterkt de interesse in dit scenario. Fundamenteel blijft Ethereum sterk. Het aantal ETH tokens dat via staking is vastgezet, blijft groeien. Dat verkleint de vrije circulatie en vermindert verkoopdruk. Tegelijk blijft het netwerk intensief gebruikt voor DeFi, NFT’s en stablecoins. Deze activiteiten zorgen voor een stabiele vraag naar ETH, ook wanneer de prijs tijdelijk onder druk staat. Fundamentele drijfveren achter de Ethereum koers De Ethereum koers wordt echter niet alleen bepaald door candles en patronen, maar ook door bredere factoren. Een stijgend percentage van de totale ETH supply staat vast in staking contracten. Hierdoor neemt de liquiditeit op exchanges af. Dit kan prijsschommelingen versterken wanneer er plotseling meer koopdruk ontstaat. Daarnaast is Ethereum nog steeds het grootste smart contract platform. Nieuwe standaarden zoals ERC-8004 en ontwikkelingen rond layer-2 oplossingen houden de activiteit hoog. Deze technologische vooruitgang kan de waardepropositie ondersteunen en zo indirect bijdragen aan een ETH prijsherstel. Het belang van de korte termijn dynamiek De komende handelsdagen zullen duidelijk maken of de bulls genoeg kracht hebben om door de weerstandszone rond $4.550 te breken. Voor de bears ligt de focus juist op het verdedigen van de prijsregio rond $4.516. De whales, die met grote handelsorders opereren, kunnen hierin een beslissende rol spelen. Het dubbele TD Sequential signaal blijft hoe dan ook een zeldzame gebeurtenis. Voor cryptoanalisten vormt het een objectief aanknopingspunt om de kracht van de huidige Ethereum trend te toetsen. Vooruitblik op de ETH koers Ethereum liet twee opeenvolgende TD Sequential signalen zien op de uurgrafiek, iets wat zelden voorkomt. Deze formatie viel samen met steun rond $4.516, waar de bulls actief werden. Als de Ethereum koers boven dit niveau blijft, kan er ruimte ontstaan richting $4.550 en mogelijk $4.650. Zakt de prijs toch opnieuw onder $4.516, dan komen $4.500 en $4.450 in beeld als nieuwe steunzones. De combinatie van zeldzame indicatoren en een sterke fundamentele basis maakt Ethereum interessant voor zowel technische als fundamentele analyses. Of de bulls het momentum echt kunnen overnemen, zal blijken zodra de Ethereum koers de eerstvolgende weerstanden opnieuw test. Koop je crypto via Best Wallet Best wallet is een topklasse crypto wallet waarmee je anoniem crypto kan kopen. Met meer dan 60 chains gesupport kan je al je main crypto coins aanschaffen via Best Wallet. Best wallet - betrouwbare en anonieme wallet Best wallet - betrouwbare en anonieme wallet Meer dan 60 chains beschikbaar voor alle crypto Vroege toegang tot nieuwe projecten Hoge staking belongingen Lage transactiekosten Best wallet review Koop nu via Best Wallet Let op: cryptocurrency is een zeer volatiele en ongereguleerde investering. Doe je eigen onderzoek. Het bericht Ethereum koers toont zeldzaam dubbel koopsignaal en richt zich op $4.550 is geschreven door Dirk van Haaster en verscheen als eerst op Bitcoinmagazine.nl.
Share
Coinstats2025/09/17 23:31
UK Gilt Yields Spike As Burnham Win Opens Door To Oust Starmer

UK Gilt Yields Spike As Burnham Win Opens Door To Oust Starmer

UK Gilt Yields Spike As Burnham Win Opens Door To Oust Starmer The odds of embattled UK Prime Minister Keir Starmer being ousted by the end of July
Share
ZeroHedge2026/06/19 21:05

Score Your Share of 50K USDT

Score Your Share of 50K USDTScore Your Share of 50K USDT

Complete DEX+ tasks to unlock the Champion Wheel