

Ethereum Falls Below $1,800 as Monthly Hammer Pattern Eyes $15K
Ethereum is under pressure again. ETH has dropped below $1,800, and traders are now watching a key zone between $1,700 and $1,750. That level has been held before. Whether it holds against could set the tone for the next major move.
At the same time, monthly chart watchers are pointing to a pattern that has played out four times before. A hammer candle forming at the $1,000–$1,500 zone could be a signal that a much larger rally is coming.
What Is a Monthly Hammer Candle, Why ETH Traders Are Watching One Now
A hammer candle forms when a market drops sharply during a period but then closes near the top. It looks like a hammer with a long lower wick. On a monthly chart, this pattern carries more weight because it takes 30 days to form.
For Ethereum, this pattern has appeared at every major bottom since 2016:
-
December 2016: ETH printed a hammer near $6. The coin rallied to $1,420.
-
December 2018: Hammer near $81. ETH climbed to $364.
-
March 2020: Hammer near $90. ETH ran to $4,867.
-
April 2025: Hammer near $1,383. ETH recovered to $4,955.
Each time this candle appeared at a key support zone, a major bull run followed. Right now, traders are asking if June 2026 could be another one of those moments.
Ethereum Price Today: ETH Falls Below $1,800 — Key Levels Explained
ETH is currently trading near $1,777. The current monthly candle opened at $2,004, hit a high of $2,018, and fell to a low of $1,505 before recovering.
That's a big wick on the downside, which is exactly what forms the base of a hammer candle. But it needs to close strongly to confirm the pattern.
Analyst @TedPillows flagged on X (formerly Twitter) that ETH falling below $1,800 puts the $1,700–$1,750 zone in focus as a short-term support. If that level fails, a drop toward sub-$1,500 becomes more likely.
The monthly chart shows an Accumulation Zone highlighted between roughly $1,000 and $1,500. This is the same zone where prior hammer candles formed in 2018 and 2020.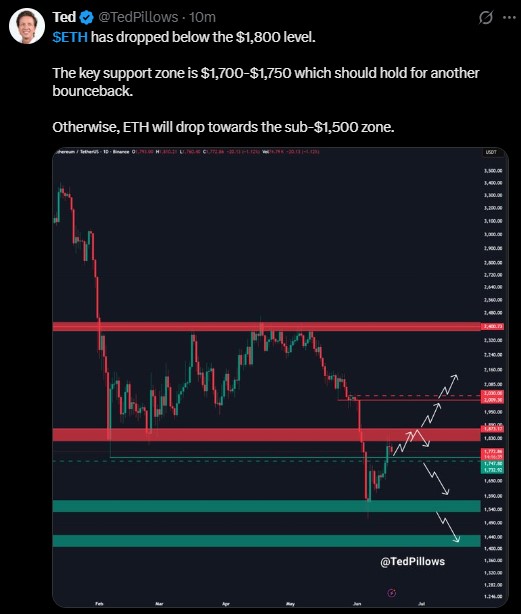
What Does ETH's Monthly Chart Say About a $10K–$15K Target?
The long-term chart by CryptoPatel on TradingView (Coinbase ETH/USD, 1M) shows a clear pattern. Every time Ethereum formed a hammer candle at a major support zone, the next move was a gain of hundreds of percent.
If the current candle closes as a strong monthly hammer at the accumulation zone, the chart suggests a potential move toward $10,000–$15,000 in the next altseason.
The $15,000 level is marked as a horizontal resistance on the chart. Getting there from the $1,000s would represent roughly a 1,000% move, similar to the April 2025 cycle's 1,002% rally from the low.
This is not a guaranteed outcome. Markets can behave differently each cycle. But the pattern has repeated itself four times over nine years, which is why analysts are watching closely.
Fed Fund Rates at 350–375 bps: What It Means for Ethereum Price
Today is June 17, 2026, and the Fed meeting data shows a 99.6% probability of no change to the current interest rate target of 350–375 basis points. Only a 0.4% chance is being priced in for a rate hike.
A stable rate environment generally reduces pressure on risk assets like crypto. Markets often react positively when the Fed stays on hold, particularly if forward guidance signals potential cuts.
For Ethereum, this backdrop could support a recovery if the technical setup aligns.
Ethereum Price Levels to Watch: $1,750 Support, $15K Long-Term Target
Based on the current technical and macro data, here are the key levels:
|
Level |
Zone |
Significance |
|
$1,700–$1,750 |
Immediate Support |
Short-term bounce zone |
|
$1,000–$1,500 |
Major Accumulation Zone |
Historical hammer candle area |
|
~$1,777 |
Current Price |
— |
|
$2,000–$2,100 |
Near Resistance |
Recovery target |
|
$10,000–$15,000 |
Long-Term Target |
If the monthly hammer confirms |
The next few weeks will be critical. The monthly candle closes at the end of June. If ETH can hold above $1,500 and close the month with a long lower wick and a strong body, the hammer pattern could officially be confirmed.
Will ETH Rally in Altseason 2026? Here's What the Data Shows
Nobody knows for certain. Crypto markets are volatile, and past patterns do not guarantee future results. But the historical record on Ethereum's monthly hammer candles is difficult to ignore.
Four times in nine years, the same pattern appeared. Four times, a major rally followed. The key variable each time was whether the candle closed strongly enough to count as a confirmed hammer.
Right now, that question is still open. Traders will be watching the June 30 monthly close very closely.
DISCLAIMER: This article is for informational purposes only and does not constitute financial advice. Cryptocurrency investments are highly volatile and speculative. Always do your own research and consult a qualified financial advisor before making any investment decisions.


You May Also Like

World Cup, America 250 face new risk with spy law lapse

Redwood AI Corp. Leverages Artificial Intelligence to Accelerate Chemistry R&D Across Multiple Industries
SUI Price Prediction: Analyst Says a 10X Rally Is Still Possible


