

Solana (SOL) Rallies 20% as Traders Focus on Critical Resistance Zone
Key Takeaways
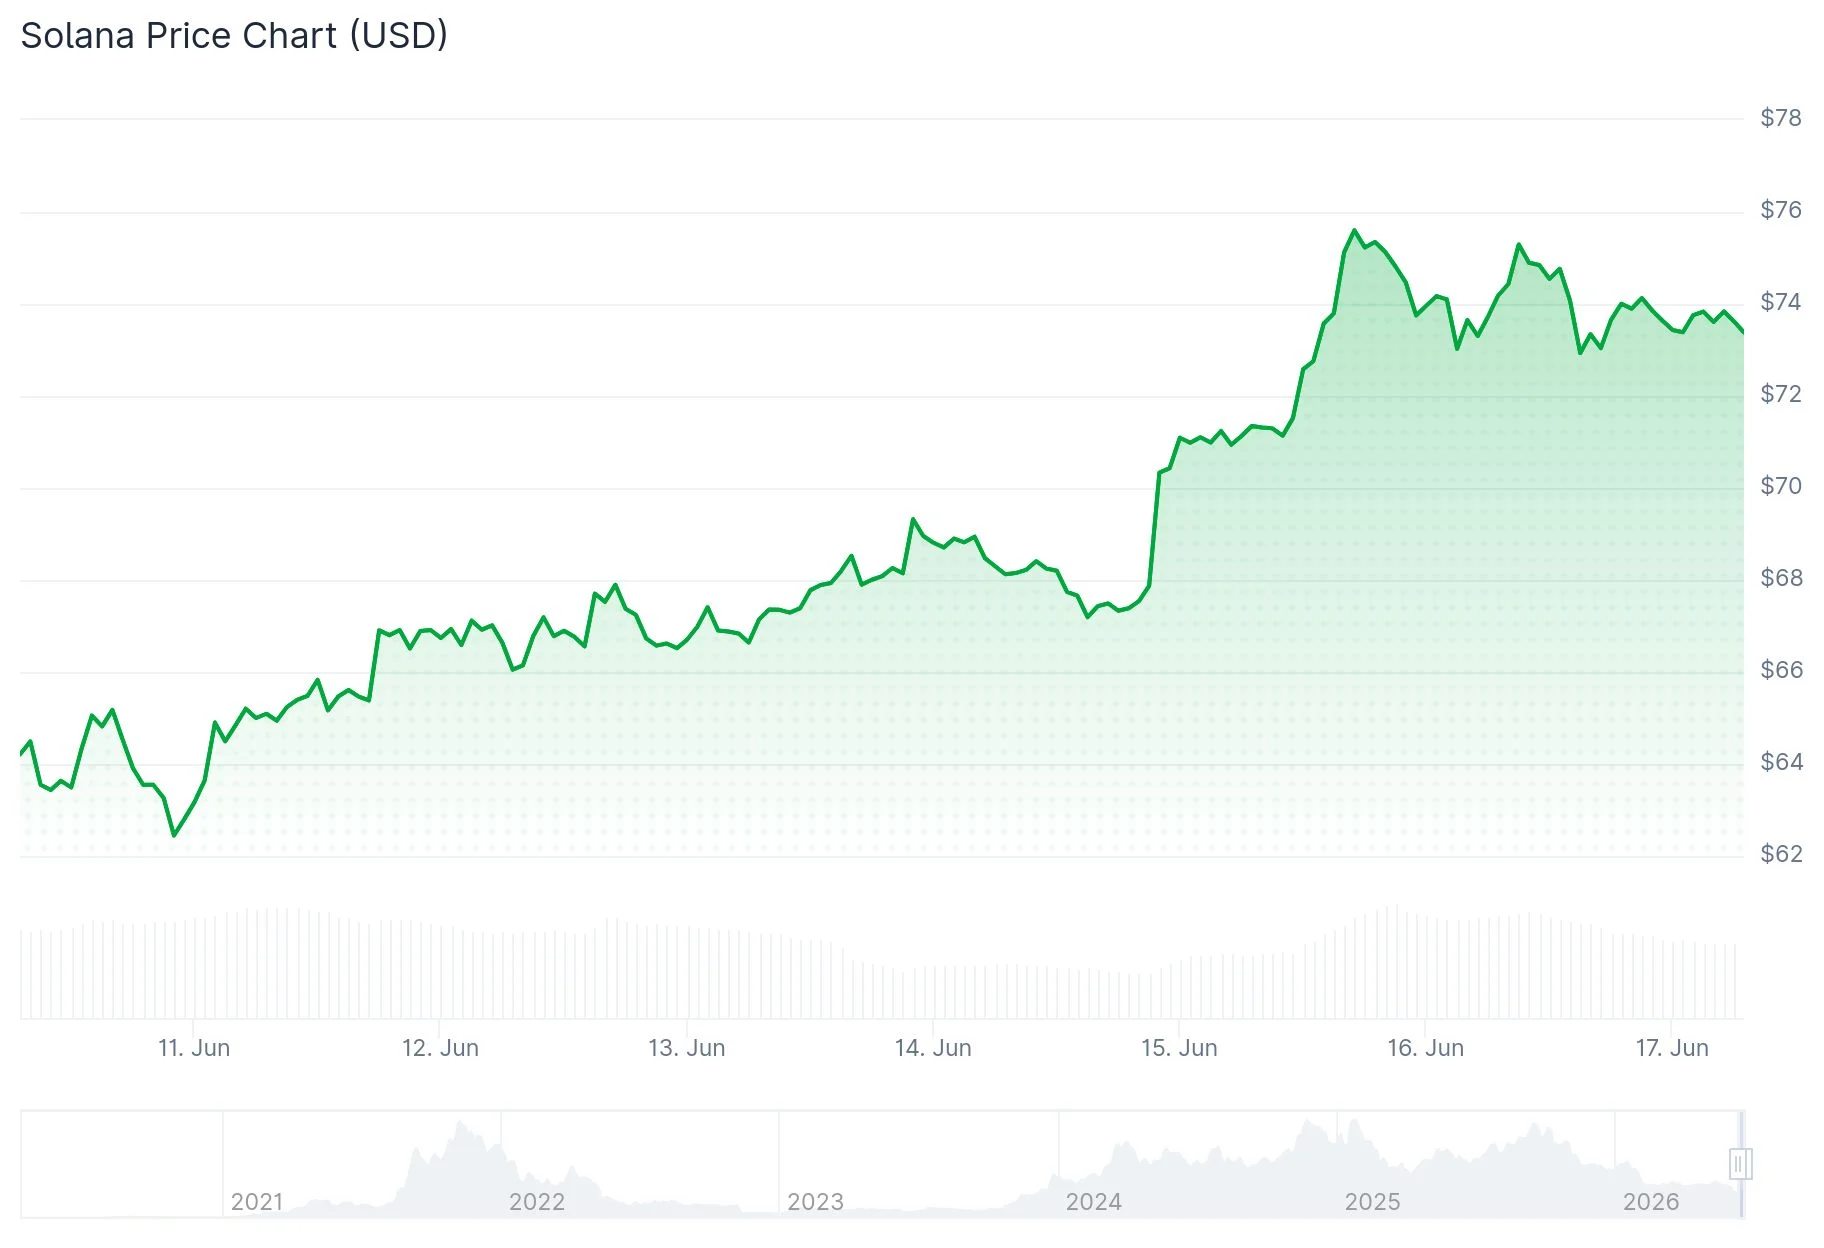
- SOL has rallied more than 20% from its June bottom around $60, currently hovering near $75
- The token faces a pivotal test at the $75.7 zone, previously a critical support level that could unlock moves to $83.5, $90, and $98
- Technical analyst Satoshi Flipper identified a falling wedge pattern break suggesting potential upside toward $250
- Daan Crypto Trades noted SOL’s breakout from a consolidating wedge against Bitcoin, monitoring for confirmation
- Contrarian view from Crypto Coral highlights bearish flag pattern risks and potential for renewed downside pressure
Solana has mounted an impressive comeback from its June bottom, posting gains exceeding 20% in recent days. This rally has positioned SOL at a technical crossroads that may determine its trajectory in the weeks ahead.
 Solana (SOL) Price
As of June 16, SOL was changing hands around $75, marking a substantial recovery from the $60 region tested earlier this month.
The upward momentum received support from broader market catalysts. News emerged that the United States and Iran had negotiated a preliminary deal to maintain open access to the Strait of Hormuz, alleviating inflationary pressures. Crude oil prices declined following the announcement, while Bitcoin, Ethereum, and other digital assets caught a bid.
Derivatives metrics confirmed the bullish shift. Data from CoinGlass indicated rising open interest alongside the price advance. Short squeeze activity also contributed momentum, as leveraged bearish positions were liquidated during the climb from the low $60s.
On the business front, Solana Company turned down an unsolicited takeover bid from Forward Industries on June 15. The proposal offered a premium valuation and emerged amid growing competition among companies developing SOL-focused treasury operations.
Technical Picture Takes Shape
The daily timeframe reveals that Solana consolidated within a defined range for approximately four months, bounded by support at $75.7 and resistance at $98.3. This structure collapsed in early June when price breached the lower boundary and descended toward $60.
SOL has now circled back to challenge that previous support zone. A decisive reclaim of this area would negate the earlier breakdown and bring $83.5, $90, and ultimately $98.3 back into play as upside objectives.
Zooming into the four-hour perspective, SOL has pierced through a downward-sloping trendline that contained rallies since late May. The Relative Strength Index has climbed back above the neutral 50 mark after dipping into oversold territory, while the MACD indicator shows early signs of bullish crossover.
Trader Daan Crypto Trades shared on X that Solana appears to be escaping from a consolidation wedge pattern relative to BTC. He suggested that a confirmed breakout could trigger follow-through buying and lift related ecosystem tokens, though he emphasized the current zone represents meaningful resistance.
Analyst Satoshi Flipper spotted a falling wedge breakout pattern on the daily timeframe, with price successfully reclaiming the upper boundary near $70. His analysis projects a longer-term objective at $250, a level that would match peaks achieved during Solana’s previous bull market phase.
Critical Zones Above and Below Current Price
Technical analyst More Crypto Online identified a concentrated Fibonacci resistance cluster spanning $69.44 to $72.58 on the four-hour chart. This zone represents the convergence of the 38.2% retracement level, 100% Elliott Wave extension, and 50% retracement—creating a formidable obstacle.
Not every market observer shares the optimistic view. Crypto Coral cautioned on June 16 that Solana had violated a bearish flag formation and is now retesting significant EMA resistance. According to this analysis, failure to recapture that level could trigger another downward move.
Should the $75 zone fail to provide support, traders are eyeing $71.8, $69.1, and the June low near $60 as successive downside targets.
The Supertrend indicator on the four-hour chart currently places support in the vicinity of $70.9.
The post Solana (SOL) Rallies 20% as Traders Focus on Critical Resistance Zone appeared first on Blockonomi.


You May Also Like

Eurozone Inflation Climbs to 3.2% in May Amid Iran Conflict and Energy Crisis

NetJets Business Jet Crashes On Texas Highway

Moody’s Assigns First-Ever Rating to Bitcoin-Backed Municipal Bond in Historic Crypto Finance Move


