Samsung Stock breaks out on thin volume as strike risk looms

Samsung Stock (SSNLF) closed at 65.21 on a one‑bar breakout that flipped the daily model bullish, yet volume was just 200 shares and momentum is maxed, leaving fragile, headline‑driven upside.
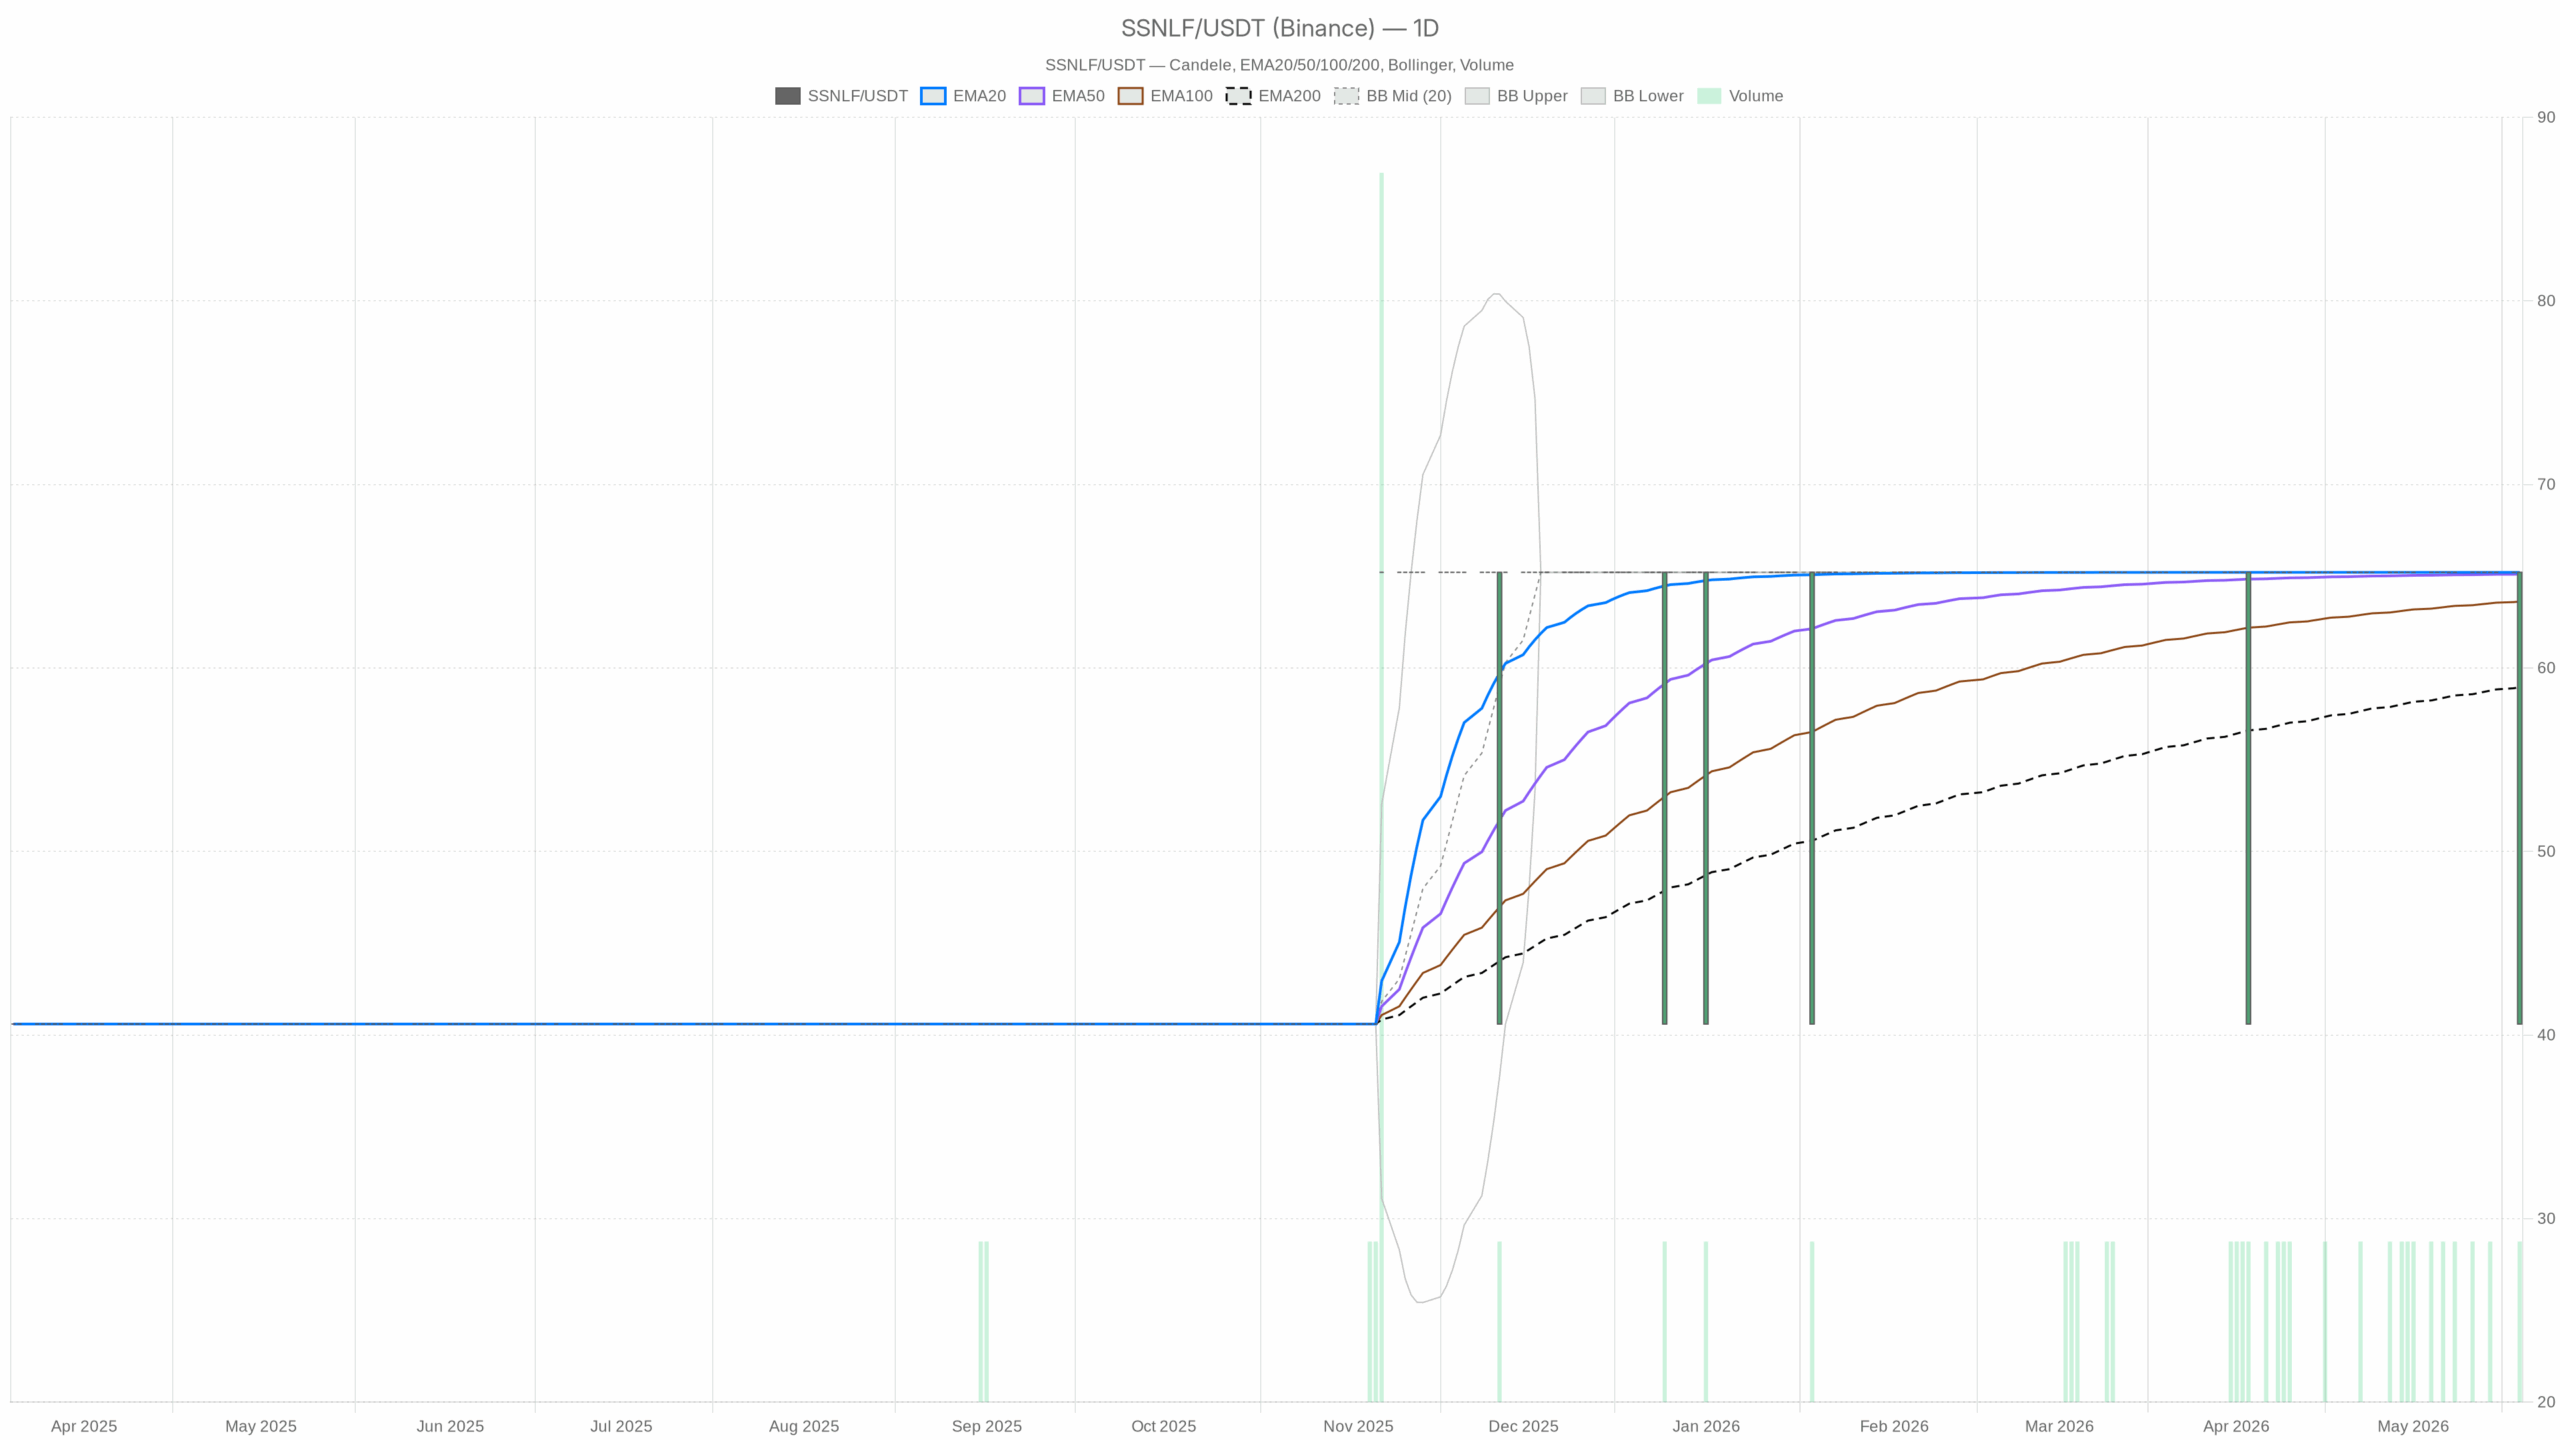 SSNLF — daily chart with candlesticks, EMA20/EMA50 and volume.
Daily Samsung Stock outlook: bullish flip on thin confirmation
Trend structure and EMAs
Price finished at 65.21 with the EMAs now positively stacked: EMA20 65.21, EMA50 65.11, EMA200 58.96. Structure is bullish above the 50‑ and 200‑day, but the gap versus the 200‑day is stretched and vulnerable to mean reversion. The model’s regime flag is “bullish,” yet it still needs follow‑through on real volume.
Momentum and bands after the spike
RSI14 100 is a blow‑off reading that often precedes cooling or consolidation. Meanwhile, MACD on D1 sits flat at line 0, signal 0, histogram 0, offering no directional edge after the one‑bar surge. Bollinger Bands are effectively pinned with mid, upper, and lower all at 65.21, so near‑term volatility signals are unreliable until price normalizes.
Volatility and daily levels
ATR14 1.76 indicates modest typical swings. Today’s range far exceeded that norm and may not be repeatable. Daily pivots print PP 57.01, R1 73.41, and S1 48.8. PP is the first logical pullback area, R1 the next resistance if momentum extends, while S1 defines deeper downside risk if the breakout fails.
Intraday timeframe: stale data, no confirmation
Meanwhile, intraday data do not corroborate the daily surge. H1 prints are dated (2025‑03‑07) with price stuck at 40.6, EMA20 40.6, EMA50 40.74, EMA200 42.2, RSI14 42.3, ATR14 0, and a “bearish” regime.
The dataset appears stale with no liquidity, so it cannot confirm or deny the new daily trend. In contrast, the 15m frame mirrors the same frozen readings, making execution signals unreliable until fresh data arrive.
Event risk for Samsung Stock: strike threat tied to AI cycle
Notably, labor headlines add event risk. Union talks have collapsed and a strike threat looms around May 21, with commentary linking outcomes to the AI chip cycle. Production or shipment disruption could jar near‑term pricing and widen gaps, especially given the thin tape implied by the 200‑share day.
Scenarios for Samsung Stock
Cautiously bullish path
Therefore, the main scenario is cautiously bullish on D1 while acknowledging fragility. A hold above the EMA50 65.11 and repeated closes near or above 65 would keep the breakout intact. Strength above the 50‑day would argue for momentum persistence and leave room for a push toward daily R1 73.41 if buyers appear.
Additional quality would come from RSI cooling into the high 60s/70s without surrendering the breakout and from a visible pickup in volume. A momentum reset with elevated participation would validate trend durability.
Bearish path and triggers
On the other hand, the bearish path is clear if the breakout gives back ground. A daily close back below the EMA50 65.11 would be the first warning. Losing the 50‑day after a spike often ushers in consolidation or a fuller retrace.
A drop through the EMA200 58.96 would downgrade the trend, shifting risk toward the daily pivot at 57.01 and, if pressure persists, S1 48.8. Headline shock from labor action could be the catalyst for that downside scenario.
Bottom line: respect the breakout, price the risk
Overall, positioning around Samsung Stock should respect the daily breakout while pricing in elevated event risk and poor confirmation from stale intraday reads. Until lower timeframes refresh, daily pivots and the EMA stack remain the cleanest map, with ATR signaling that the recent range expansion was anomalous. Expect choppy follow‑through and be mindful of gap risk around labor developments.


You May Also Like

Community dev releases Gasetta, neovest tools for Neo N3

How Stablecoins Are Changing Business Payments