

Robinhood US Listing Propels WLFI Token Above $5B Valuation
On Thursday, Sept. 25, leading financial assets trading platform Robinhood officially listed World Liberty Financial’s WLFI token. The Trump-backed project surged 3% intraday on the news, lifting WLFI price above the $0.20 resistance with its market capitalization edging towards $5 billion.
With 27.4 million funded customers as of Q2 2024, Robinhood’s listing introduces WLFI to millions of US-based retail traders. The development aligns with World Liberty Financial’s recent alliances with key crypto industry players.
On Sept. 1, Tron TRX $0.33 24h volatility: 1.5% Market cap: $31.60 B Vol. 24h: $798.56 M founder and WLFI early-investor Justin Sun confirmed a $200 million USD1 stablecoin mint on Tron’s network to boost liquidity. More recently, on Monday, ListaDAO launched WLFI lending markets on BNB Chain, offering collateralized borrowing for USDT USDT $1.00 24h volatility: 0.0% Market cap: $173.12 B Vol. 24h: $138.74 B and USD1 with 500,000 in initial liquidity and a competitive 0.55% borrowing rate.
These integrations have accelerated WLFI’s global distribution, enhancing its credibility and utility across DeFi ecosystems. WLFI token price briefly touched $0.21 on Thursday before retracing slightly, reflecting both strong demand and cautious investor sentiment.
WLFI Price Forecast: Can Bulls Defend the $0.20 Handle After Robinhood Hype?
WLFI remains in a delicate consolidation zone, with the Robinhood listing offsetting cautious macro sentiment. From a technical perspective, WLFI price trajectory remains relatively neutral despite the 3% intraday uptick. Stabilizing just above $0.20 following Thursday’s Robinhood announcement, the Relative Strength Index (RSI) reads 42, just below the neutral zone, indicating that WLFI is still trending within bearish territories.
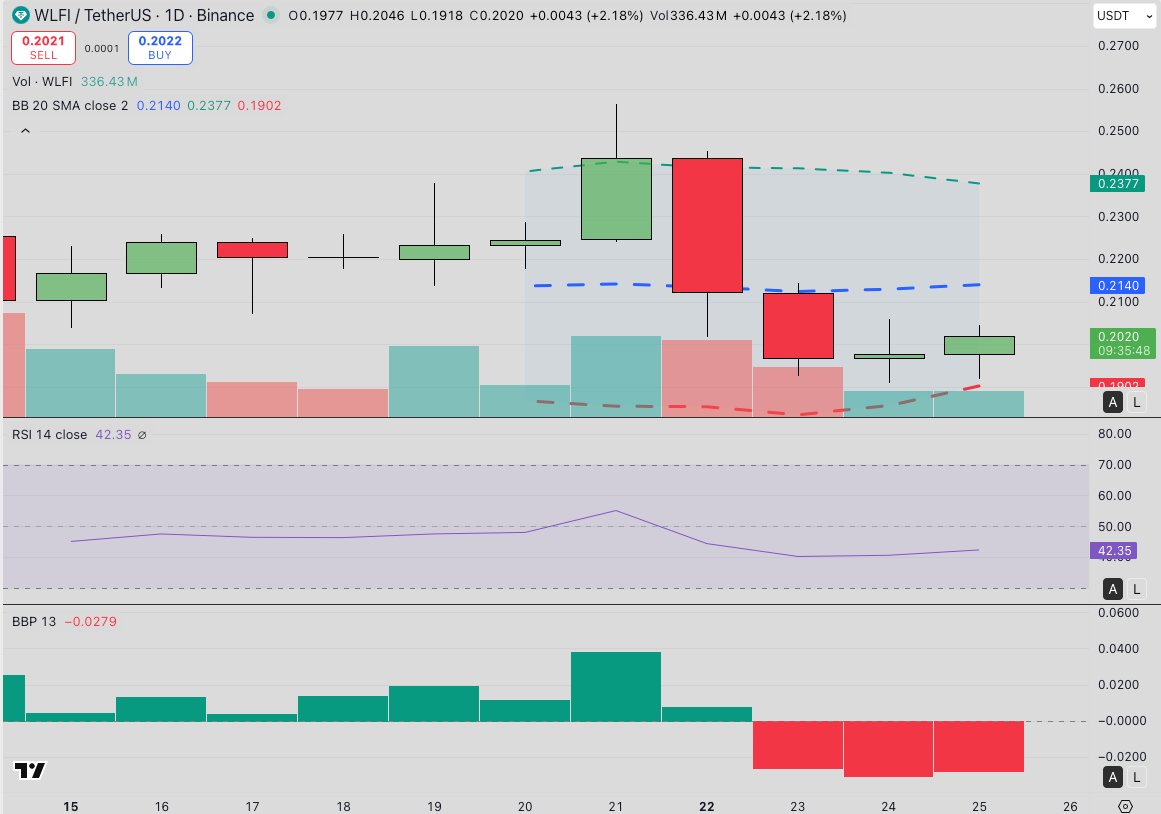
World Liberty Financial (WLFI) Technical Price Analysis | Source: TradingView
The Balance of Power (BOP) indicator currently leans negative, highlighting seller dominance in recent sessions.
Meanwhile, Bollinger Bands show price consolidating between $0.19 and $0.23. Bulls must stage a close above 20-day moving average at $0.214 to regain dominance. On the downside, the lower Bollinger Band at $0.19 serves as immediate support, and failure to hold that level could risk a retracement toward $0.18.
Best Wallet Presale Hits $16M amid Solana’s Whale Demand Surge
WLFI’s listing on Robinhood has also buoyed interest in early-stage projects like Best Wallet (BEST).
Best Wallet is a multi-chain storage solution with institutional-grade security, offering a compelling alternative for strategic investors seeking early entry into promising projects before major CEX listings.

Best Wallet Presale
At press time, the Best Wallet presale has raised over $16.1 million. With just over 24 hours remaining at current level, new entrants can still acquire BEST tokens at $0.0256 each before the next price tier unlocks.
nextThe post Robinhood US Listing Propels WLFI Token Above $5B Valuation appeared first on Coinspeaker.
You May Also Like

Microsoft Corp. $MSFT blue box area offers a buying opportunity

Marathon Digital BTC Transfers Highlight Miner Stress
