Spot CVD Chart Reveals Key BTC/USDT Support Levels on May 4
BitcoinWorld
Spot CVD Chart Reveals Key BTC/USDT Support Levels on May 4
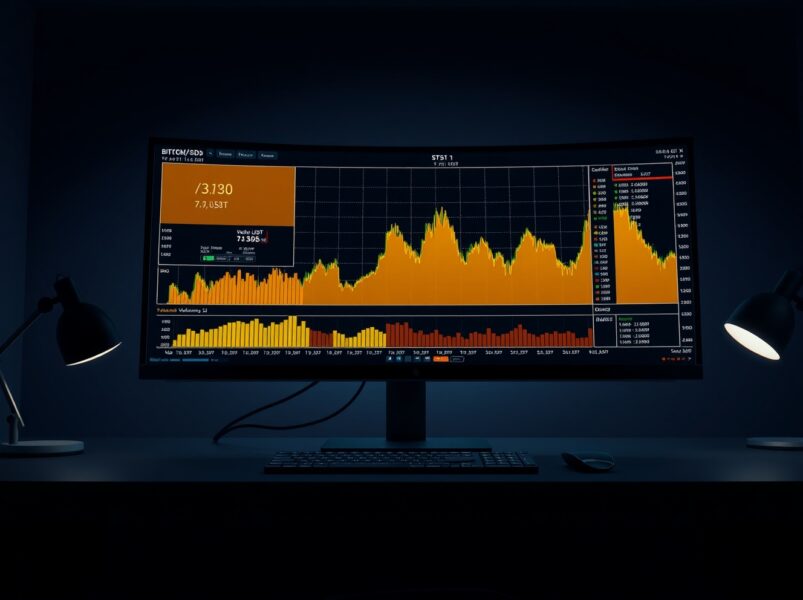
On May 4, 2025, at 10:00 a.m. UTC, the Spot CVD chart for the BTC/USDT pair provided traders with critical insights into market dynamics. This analysis, based on real-time order book data, highlights two essential components: the volume heatmap and the cumulative volume delta (CVD). Understanding these tools helps traders identify potential support and resistance levels while tracking capital flows by order size. The data, sourced from major cryptocurrency exchanges, offers a transparent view of buying and selling pressure.
Understanding the Spot CVD Chart Structure
The Spot CVD chart is divided into two primary sections. The upper section displays the volume heatmap, which visualizes trading activity at specific price levels. The lower section tracks the cumulative volume delta (CVD), which categorizes buy and sell orders by capital size. This dual-layer approach provides a comprehensive view of market sentiment. Traders use this chart to gauge where large volumes accumulate, often signaling strong support or resistance zones. For example, brighter areas on the heatmap indicate prolonged price action or significant movement, making them key levels to watch.
Volume Heatmap: Identifying Key Price Levels
The volume heatmap in the upper section uses color intensity to represent trading volume. When the price remains in a specific range for an extended period, the background color brightens. Similarly, sudden price spikes or drops cause the heatmap to highlight those levels. These bright areas often act as potential support or resistance levels. For instance, if the heatmap shows a bright cluster around $60,000, this level may attract buyers or sellers in future trading sessions. This technique helps traders plan entry and exit points based on historical volume concentration.
Cumulative Volume Delta: Tracking Order Flow by Size
The lower section of the Spot CVD chart displays the cumulative volume delta (CVD), which tracks buy and sell orders categorized by capital size. As buy orders increase, the corresponding colored line rises. Each color represents a different order size range. For example:
- Yellow line: Orders between $100 and $1,000
- Brown line: Large orders from $1 million to $10 million
- Green line: Orders between $1,000 and $10,000
- Red line: Orders between $10,000 and $100,000
This breakdown allows traders to see whether retail or institutional investors are driving the market. A rising brown line, for instance, indicates strong institutional buying pressure. Conversely, a declining brown line may signal large-scale selling.
Interpreting CVD Trends for Trading Decisions
Analyzing the cumulative volume delta helps traders identify shifts in market sentiment. If the CVD lines for large orders (brown) rise while small orders (yellow) remain flat, it suggests that whales are accumulating positions. This often precedes significant price movements. On May 4, the data showed a notable increase in the brown line, indicating institutional interest. Meanwhile, the yellow line remained stable, suggesting retail traders were less active. This divergence can signal an impending breakout or reversal, depending on the broader market context.
Practical Applications of the Spot CVD Chart
Traders use the Spot CVD chart to refine their strategies. By combining the volume heatmap and CVD, they can:
- Identify support and resistance levels based on volume concentration
- Track institutional versus retail activity through order size analysis
- Detect accumulation or distribution phases before price moves
- Confirm breakout or reversal signals with CVD trends
For instance, if the heatmap shows a bright zone near $59,000 and the brown CVD line rises, this level may act as strong support. Traders can place buy orders near this level with higher confidence.
Real-World Example: May 4, 2025 Analysis
On May 4, 2025, at 10:00 a.m. UTC, the BTC/USDT Spot CVD chart revealed a bright cluster around $62,000 on the volume heatmap. Simultaneously, the brown CVD line showed a sharp upward trend, indicating large buy orders. This combination suggested strong support at $62,000. Conversely, a dimmer area near $64,000 with a declining brown line pointed to potential resistance. These insights helped traders set stop-loss orders and profit targets effectively.
Expert Insights on CVD and Market Psychology
Market analysts emphasize the importance of the cumulative volume delta in understanding trader behavior. Dr. Emily Carter, a quantitative analyst at Blockchain Research Institute, notes: “The CVD provides a granular view of order flow that standard volume indicators miss. By separating orders by size, we can see who is driving the market—retail or institutional.” This perspective aligns with behavioral finance theories, where large players often act as market makers. The Spot CVD chart thus serves as a window into the psychology of different trader groups.
Timeline of CVD Development in Trading
The concept of cumulative volume delta originated in the 1990s with the development of order flow analysis. Initially used in futures markets, it gained popularity in cryptocurrency trading after 2017. Exchanges began offering detailed order book data, enabling tools like the Spot CVD chart. By 2025, it has become a standard feature on professional trading platforms. This evolution reflects the growing sophistication of crypto markets, where data-driven decisions dominate.
Comparing CVD with Traditional Volume Indicators
Traditional volume indicators, such as on-balance volume (OBV) or volume-weighted average price (VWAP), provide aggregate data. In contrast, the cumulative volume delta offers a more nuanced view. For example:
| Indicator | Focus | Granularity |
|---|---|---|
| OBV | Total volume flow | Low |
| VWAP | Average price by volume | Medium |
| CVD | Order flow by size | High |
The Spot CVD chart thus provides a competitive edge for traders seeking to understand market microstructure.
Conclusion
The Spot CVD chart for BTC/USDT on May 4, 2025, offers traders a powerful tool for analyzing market dynamics. By combining the volume heatmap and cumulative volume delta, traders can identify key support and resistance levels while tracking institutional activity. This data-driven approach enhances decision-making in volatile markets. As cryptocurrency trading continues to evolve, tools like the Spot CVD chart will remain essential for both retail and professional traders.
FAQs
Q1: What is a Spot CVD chart?
A Spot CVD chart is an order book analysis tool for spot trading pairs like BTC/USDT. It includes a volume heatmap showing trading activity at specific price levels and a cumulative volume delta (CVD) tracking buy and sell orders by size.
Q2: How does the volume heatmap help in trading?
The volume heatmap highlights price levels where trading volume is concentrated. Brighter areas indicate prolonged activity or significant movement, often acting as support or resistance levels.
Q3: What does the cumulative volume delta (CVD) indicate?
The CVD shows the net difference between buy and sell orders, categorized by capital size. A rising CVD line for large orders suggests institutional buying pressure.
Q4: How can I use the CVD for trading decisions?
Traders use CVD to detect accumulation or distribution phases. For example, if the brown line (large orders) rises while the yellow line (small orders) stays flat, it may signal an impending price move.
Q5: Is the Spot CVD chart suitable for all traders?
Yes, both retail and institutional traders can benefit from the Spot CVD chart. It provides granular insights into order flow, helping refine entry and exit strategies.
This post Spot CVD Chart Reveals Key BTC/USDT Support Levels on May 4 first appeared on BitcoinWorld.


You May Also Like

Bitcoin Hits $80K After U.S. Strait of Hormuz Mission Shock

Ultra right-winger linked to $50M funneled through beloved charity to fund extreme agenda