Why Is Gold Price Falling?
Gold price action has not been doing well in recent weeks. The metal fell from over $4,800 to $4,700, and now it has dipped below $4,600.
There have been no crazy crashes, but the trend is clearly down. Given gold’s reputation as a safe haven, the question is worth asking: why is gold price actually falling?
Rob Kientz – Low Open Interest and a Quiet Base
Analyst Rob Kientz tweeted that gold is falling because open interest on the COMEX is low. Buyers are staying away. The market is high risk, and only smart bidders are active in futures. He believes that when the full effects of inflation caused by the Hormuz closure and oil shortages are felt, this will reverse. Gold, in his view, is building a quiet base and will explode when the market understands how inflation will rise.
 Source: X/@freedom_rpt
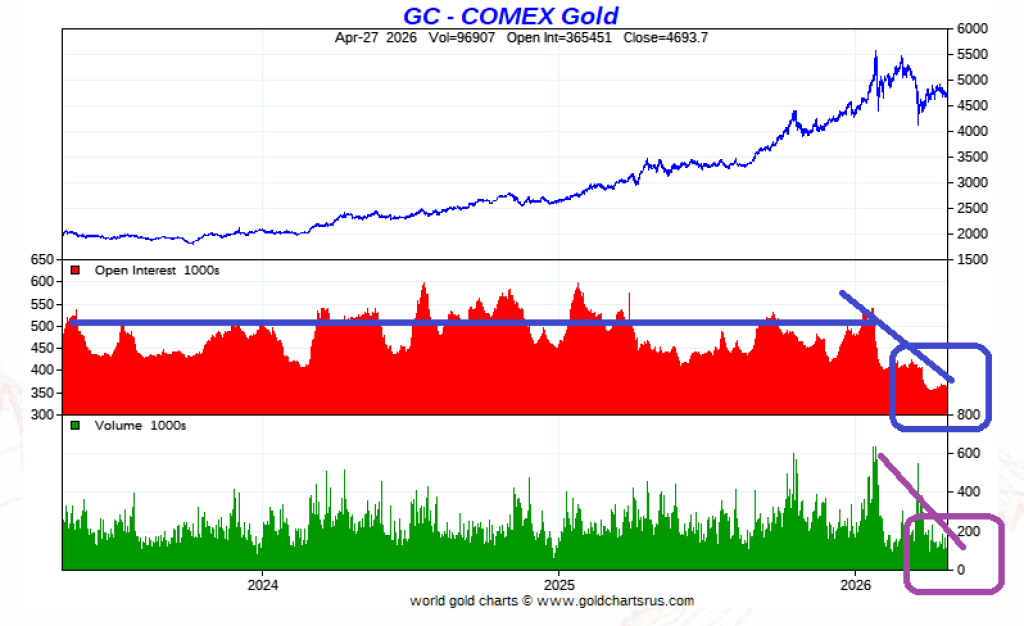
The attached COMEX Gold chart from shows the price action from 2024 to April 27, 2026. The top panel plots price (close at 4,693.7 on April 27). The middle panel shows open interest (365,451 contracts). The bottom panel displays volume in thousands. Price peaked near $5,500–$5,600 in early 2026, then declined to current levels. Open interest has been drifting lower, confirming that new buyers are not stepping in.
Volume has also cooled. This supports Kientz’s argument: the futures market lacks participation, and without aggressive buying, prices drift down. The chart structure shows a clear downtrend since the February blow-off top, with lower highs and lower lows forming on the daily timeframe.
Gold Chart Analysis – A Corrective Phase Within a Bull Trend
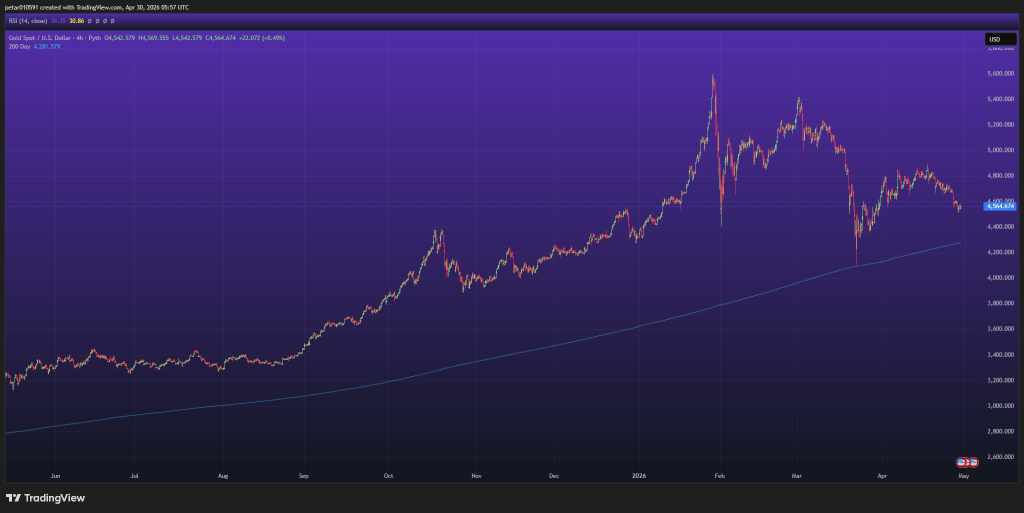
Gold experienced three distinct phases. Phase one was a gradual uptrend from mid-2025 to late 2025, climbing from roughly $2,900 to $4,200 with clean higher highs and higher lows – a healthy accumulation and trend phase. Phase two was an acceleration and blow-off top in January–February 2026, a parabolic move to approximately $5,500–$5,600 followed by a violent rejection and large wicks (a liquidation event). That was classic late-stage euphoria followed by exhaustion. Phase three is the current distribution and correction, with lower highs forming, a price range between $4,400 and $5,200, and the metal now trading near $4,560.
Related analysis: Here’s Where Silver and Gold Prices Could Be Headed In May
Gold Price: Key Levels and Indicators to Watch
Current support is at $4,500–$4,550 (being tested now). Major structural support sits at $4,300–$4,400, and the macro trend support (200-period moving average) is near $4,200. Immediate resistance is at $4,750–$4,800, with a major supply zone at $5,000–$5,200.
 Source: TradingView
The 200 MA is rising steadily near $4,280, and gold remains above it. That means the long-term trend is still bullish, and the current move is a pullback within that uptrend. No macro breakdown occurs unless price loses the 200 MA.
RSI on the top panel is currently around 30–36, near oversold territory. Momentum is weak in the short term, and the market has cooled significantly. This often leads to a relief bounce or continuation lower – confirmation is needed.
Zooming into recent structure, we see lower highs: $5,200 → $4,900 → $4,800, and now price is testing support again. This is a short-term bearish structure inside a long-term bullish trend. The market is not trending strongly; it is in a distribution and consolidation phase. Buyers are weaker short-term, and sellers are controlling rallies.
Gold Price Predictions – Scenarios and Outlook
Below are our current gold price predictions:
Bullish case: If gold holds $4,500 and reclaims $4,750–$4,800, a move toward $5,000–$5,200 becomes likely. That would confirm that the correction is over and the uptrend is resuming.
Bearish case (more likely short-term): If gold breaks below $4,500, a fast move toward $4,300 and possibly $4,200 (the 200 MA) would follow. That is where strong buyers should appear. Unlike silver, gold is not compressing tightly; it is gradually bleeding lower, which suggests it may sweep lower liquidity first before moving higher.
Price predictions: Short-term (days): bullish target $4,750–$4,800, bearish target $4,300–$4,400. Mid-term (weeks): bullish continuation would target $5,000–$5,200; a deeper correction would retest $4,200.
The best approach right now is conservative: wait for a bounce from $4,500 or a breakdown confirmation. Aggressive traders could go long near $4,500 support or short if $4,500 breaks. Avoid trading in the middle ($4,600–$4,700) and chasing moves without confirmation. The long-term trend remains bullish, but the short-term trend is bearish and corrective. Gold is pulling back after a massive run, and it is now testing whether the uptrend can continue.
FAQs

Gold is valuable because it is scarce, durable, divisible, and has been used as money and a store of value for thousands of years, with central banks and investors trusting it as a hedge against inflation and currency debasement.
Gold is dropping due to low open interest on COMEX futures, weak buyer participation, and a post‑euphoria correction after the February blow‑off top, as traders rotate into risk assets and the dollar remains firm.
Gold is generally cheapest in major refining hubs like Dubai, Hong Kong, and Switzerland due to lower taxes and import duties, but prices vary daily; retail buyers should compare local premiums and VAT rates.
Subscribe to our YouTube channel for daily crypto updates, market insights, and expert analysis.
The post Why Is Gold Price Falling? appeared first on CaptainAltcoin.


You May Also Like

White House Blocks Anthropic’s Plan to Expand Access to Its Mythos AI Model

WLFI Token Unlock Advances with 99.5% Support