

USDC Weekly Technical Analysis: Stability Holds as Price Maintains Peg Near $1
In the world of cryptocurrency, where triple-digit percentage swings are routine, USDC’s consistent anchoring near $1.00 is not a sign of boredom — it is a sign of engineering precision under pressure. This week, as broader crypto markets navigated geopolitical uncertainty, a DeFi liquidity crisis, and renewed regulatory dialogue, USDC held its peg with the quiet authority of a well-built financial instrument. But beneath the flat price line, the technical story is far more layered. Understanding USDC’s peg mechanics, stress responses, dominance movements, and reserve infrastructure reveals the true picture for traders, institutions, and DeFi participants alike.
Price Action: The Anatomy of a $1.00 Peg in 2026
The price of USDC stood at $0.9997 as of April 25, 2026, with a 24-hour trading volume of $3.73 billion, trading in a historically tight band well within the expected stability range.
From a pure technical standpoint, USDC does not exhibit the classic chart structures — no support/resistance breakouts, no RSI divergences, no Bollinger Band expansions in the traditional sense. USDC’s price has traded in a tight band between approximately $0.999 and $1.001 for recent days, with an all-time high near $1.17 and an all-time low near $0.88 during rare historic stress events. The meaningful technical analysis therefore shifts from candlestick patterns to on-chain flow data, reserve composition, arbitrage bandwidth, and utilization metrics — all of which tell a gripping story this week.
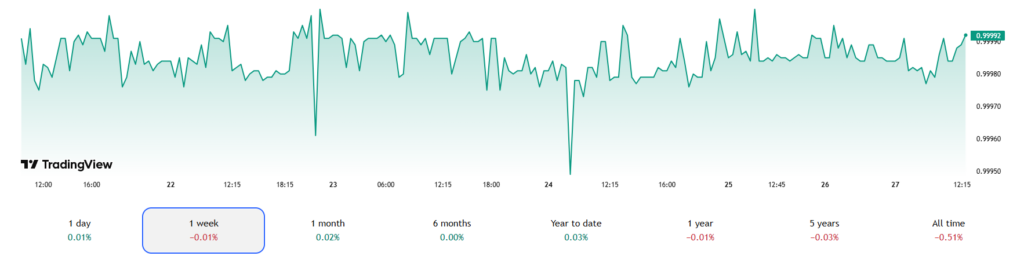 Source: TradingView
The Peg Mechanism: Why $1.00 Is Structurally Enforced
USDC’s stability is not a coincidence — it is an architecture. The USDC reserve is held approximately 80% in short-dated U.S. Treasuries and 20% in cash deposits within the U.S. banking system, with the majority held in the Circle Reserve Fund, an SEC-registered 2a-7 government money market fund.
The arbitrage engine that enforces the peg operates in both directions simultaneously. When USDC trades above $1.00, arbitrageurs can mint new USDC tokens from Circle at the exact $1.00 rate and sell them on secondary markets for a profit, increasing supply and bringing the price down. Conversely, when USDC trades below $1.00, arbitrageurs can purchase discounted USDC on secondary markets and redeem them directly with Circle for exactly $1.00, reducing circulating supply and supporting the price back to parity.
This dual-direction pressure is reinforced by AMM pools on Curve and Uniswap, which add another layer of automated rebalancing — making any meaningful deviation statistically short-lived under normal conditions.
Downside Risk: The Aave Utilization Crisis — A Live Stress Test
The most technically significant bearish pressure event of the week was not a price collapse — it was a liquidity freeze on Aave V3 Ethereum Core. This serves as a real-time stress test of USDC’s DeFi resilience.
USDC on Aave v3 Ethereum Core was pinned at 99.87% utilization for four consecutive days, with available liquidity sitting below $3 million, while total supply contracted by roughly $60 million in 24 hours. The freeze traced back to the April 18 KelpDAO rsETH exploit, which triggered approximately $300 million in incremental borrowing.
This scenario is the equivalent of a bank run in miniature — a sudden demand shock consuming available float. The response metric traders watch in this environment is borrow rate velocity. When utilization hits near-100%, borrow costs spike exponentially, trapping capital and disincentivizing new supply entrants. The locked pool effectively creates a shadow depeg in DeFi yield terms, even if spot price holds at $1.00.
Circle’s intervention was swift: Circle’s Chief Economist Gordon Liao proposed raising Slope 2 to 40% and lowering optimal utilization to 87% as an immediate Risk Steward action, with a follow-up governance vote to push rates to final targets.Circle CEO Jeremy Allaire’s public endorsement on X added institutional credibility to the emergency response, reinforcing that the protocol’s leadership treats DeFi liquidity integrity as a first-order priority.
Upside Catalysts: Regulatory Wins and Adoption Momentum
Several bullish structural developments this week provide technical tailwinds for USDC’s peg and broader adoption:
Pornhub Creator Payout Switch (April 22): The world’s most-visited adult website announced it is switching its crypto payout option for creators from USDT to USDC, citing USDC’s fully-backed, MiCA-compliant, and regulated status, with creators required to update payment information by June 1, 2026.While unconventional, this represents meaningful real-world transaction volume migrating to USDC rails — a demand signal institutions watch.
Digital Dollar Interoperability Act: Expected legislation in late April 2026 is designed to formally cement USDC’s legal status and boost institutional adoption, following the Global Stablecoin Framework established in late 2025 and recognition by the Basel Committee and Financial Stability Board. Legislative certainty tightens the peg by reducing regulatory risk premium that holders implicitly price in.
Supply Target Expansion: Circle is targeting a circulating supply of $150 billion in the second half of 2026, up from approximately $112 billion as of April 10, 2026, with growth expected to be fueled by demand from DePIN projects and deeper integration via CCTP V3.0.
BIS Warning: The Bear Flag on the Horizon
Not all signals are green. The Bank for International Settlements warned that large U.S. dollar stablecoins pose financial stability risks and require stronger global regulatory coordination — a statement that, while not targeting USDC specifically, adds headline risk to the entire stablecoin category. Should BIS-driven regulatory frameworks introduce redemption restrictions, transaction caps, or reserve mandates beyond current standards, USDC’s peg could face structural headwinds rather than isolated stress events.
Historical Peg Resilience: The Benchmark Context
USDC temporarily lost its dollar peg in March 2023 when Circle disclosed that approximately $3.3 billion (8% of reserves) were held at Silicon Valley Bank during its collapse, with USDC briefly trading as low as $0.88 before recovering after federal regulators guaranteed SVB deposits.
That event is the single most important historical data point for USDC technical risk modelers. The peg recovered within 72 hours — a stress-test result that institutional participants now cite as evidence of USDC’s structural resilience. No comparable event has threatened the peg since, and the reserve architecture has been strengthened considerably, with BlackRock managing USDC’s cash reserves through the Circle Reserve Fund and BNY Mellon serving as the primary custodian.
Technical Summary Scorecard
| Indicator | Reading | Signal |
| Spot Price (Apr 25) | $0.9997 | ✅ Peg Intact |
| Aave V3 Utilization | 99.87% | 🔴 DeFi Stress |
| 24H Trading Volume | $3.73B | 🟡 Moderate |
| Circulating Supply | ~$112B | ✅ Bullish Growth |
| Reserve Composition | 80% UST / 20% Cash | ✅ High Quality |
| Regulatory Environment | GENIUS Act Compliant | ✅ Institutional Bullish |
| BIS Warning | Systemic Risk Flag | 🔴 Macro Headwind |
Conclusion: Stability Is the Strategy
This week’s USDC technical picture is defined by a paradox: the price is perfectly flat, yet the underlying activity is anything but. The Aave liquidity crisis, record Solana minting volumes, regulatory catalysts, and Circle’s governance interventions all confirm that USDC is no longer simply a trading pair — it is the load-bearing infrastructure of the digital dollar economy. For traders, the peg near $1.00 is not a price to trade; it is a benchmark to trust. The real technical signal is in the flow data, utilization rates, and institutional adoption velocity — all of which, despite this week’s friction, point structurally upward.


You May Also Like
![[Rappler’s Best] Second quarter storm](https://www.rappler.com/tachyon/2026/04/rapplers-best-second-quarter-storm-April-27-2026.jpg)
[Rappler’s Best] Second quarter storm

Trump's family creating problems for GOP as clock ticks down on president's promised bill


