

How to Read XRP RSI: Overbought, Oversold, and What It Really Means

- Before learning RSI, make sure you understand XRP basics in our complete guide.
- The RSI is a momentum oscillator that moves on a scale from 0 to 100, using a default 14-period lookback to measure how fast and how strongly price is moving.
- An XRP RSI above 70 signals overbought conditions, while a reading below 30 indicates oversold territory — but neither is a guaranteed trade signal on its own.
- RSI behaves differently across market cycles: in a bull market, readings tend to stay elevated; in a bear market, the same number can already signal strong resistance.
- RSI divergence — when price and the RSI move in opposite directions — often appears before the price reacts and is one of the most powerful signals beginners overlook.
- Pairing XRP RSI with indicators like MACD and moving averages produces stronger, more reliable signals than using RSI alone.
What Is the RSI Indicator in Crypto?
How to Read XRP RSI: Overbought and Oversold Signals Explained
XRP RSI Above 70: Overbought Territory
XRP RSI Below 30: Oversold Territory
How XRP RSI Behaves Differently in Bull and Bear Markets
XRP RSI Divergence: Bullish and Bearish Signals Explained
How to Use XRP RSI With MACD and Moving Averages
FAQ
Conclusion
- For a broader understanding of XRP's market and technology, read our comprehensive XRP guide.
Popular Articles
View More
XRP vs Bitcoin Comparison: Speed, Utility, and What Each One Actually Does
Most people searching "XRP Bitcoin" aren't confused about which is which. They're asking a sharper question: if I had to choose between the two, what am I actually choosing between? This article

Will the CLARITY Act Send XRP Past $2? XRP Price Prediction June 2026
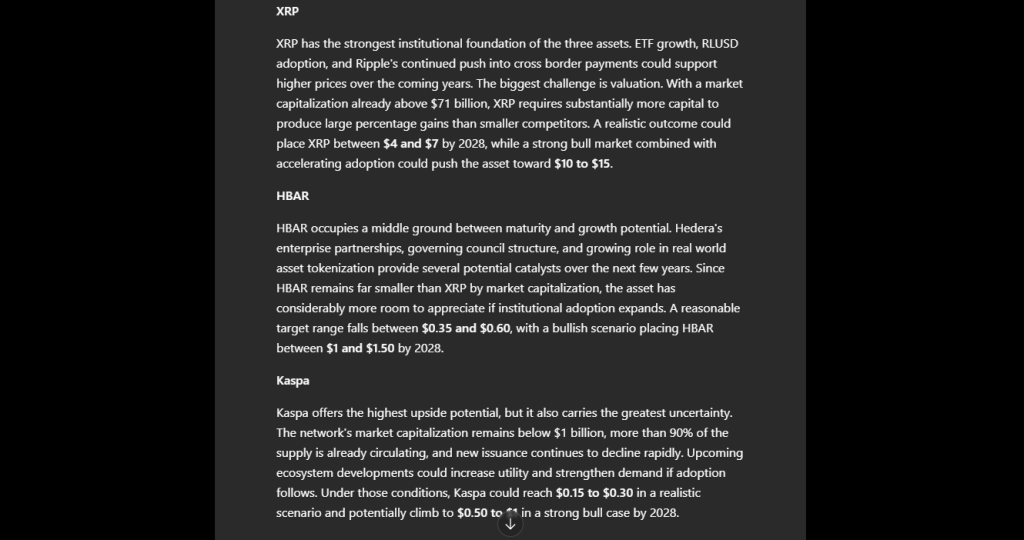
XRP is testing one of the most important price levels it has seen all year. The token dropped to around $1.20 on June 3, breaking through the $1.25 support that had been holding since February 2026.
Why Is XRP Dropping? 4 Key Reasons Behind the Price Down
XRP has puzzled investors as its price continues falling despite major positive developments. While Ripple secured regulatory wins and launched spot ETFs, XRP trades near $1.46, down roughly 60% from

Hot Crypto Updates
View More
XRP Q2 2026 Price Prediction: Has the Bottom Arrived or Is the Sell-Off Not Over?
XRP is trading near $1.24 in Q2 2026 as spot ETF inflows hit a yearly high and the CLARITY Act clears a Senate committee. Here's what analysts really expect — and why the divergence matters. Overview

XRPL 3.2.0 Is Live: The End of rippled, and What XRP Holders Actually Need to Do
XRP Ledger's v3.2.0 mainnet upgrade activated on June 15, 2026, renaming the core server software from rippled to xrpld and cutting node memory usage by up to 40%. Here's what it means for XRP

The CLARITY Act Is Closer Than Ever — What It Means for XRP, SOL, and the Next Bull Cycle
The CLARITY Act entered the Senate calendar on June 1, 2026, after a bipartisan 15-9 committee vote. With Lummis pushing for a July 4 floor vote, here's what XRP, SOL, and global crypto traders need

Trending News
View More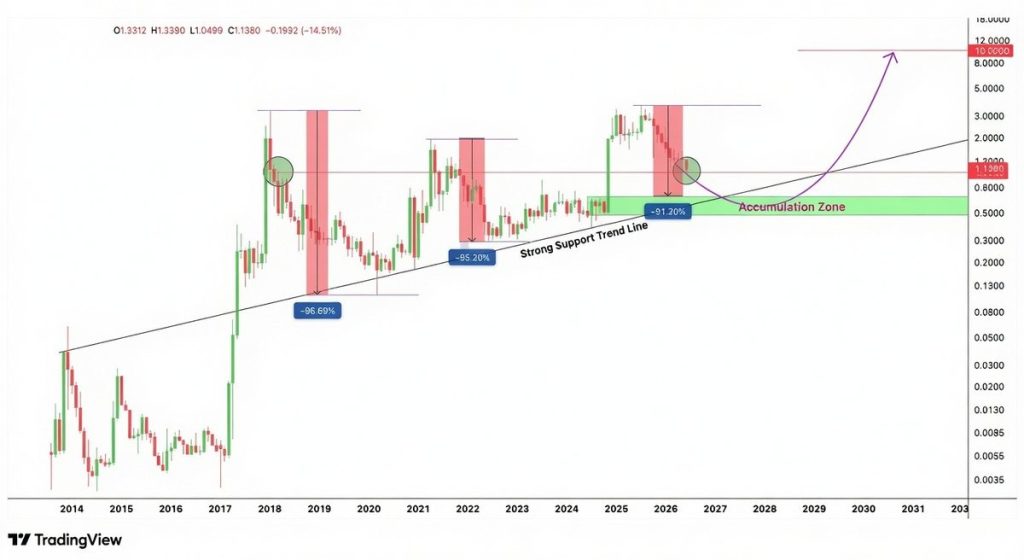
XRP Price Ready to Pop – The Longer the Range, the Bigger the Pump
The XRP price is back in focus as traders take a step back and look at its long-term structure. When you zoom out, XRP doesn’t really move in a straight line. It
Market Strategist Says Everyone Is 100% Wrong About This XRP Cycle. Here’s why
Crypto commentator Levi Rietveld is making a serious accusation against Wall Street. “These guys, they are lying,” he said, arguing that major institutions mislead

Related Articles
View More
Bitcoin Bank: What It Is and How to Move Money Between BTC and Your Bank
Bitcoin and banks used to feel like opposites.One was built to bypass the financial system — the other is the financial system.But that divide is closing fast, and if you own Bitcoin or plan to buy so

What Is Bitcoin Trader? What the Scam Warnings and Reviews Really Say
You've probably seen the name Bitcoin Trader pop up in an ad, a forum thread, or maybe a suspicious celebrity endorsement.Before you click anything, it's worth knowing exactly what this platform is —

What Is the Bitcoin Rate? BTC Price, History, and How to Track It
The Bitcoin rate changes every second, and most people have no idea why.Whether you're checking the BTC rate today or trying to make sense of your first trade, understanding what drives the Bitcoin ex


