

How to Read U.S. Stock Market Signals: Price Action, Volume, Breakouts, and Sector Rotation

Key Takeaways
- Price is the result; signals are the process. A stock's closing price is far more important than its intraday volatility.
- Volume is the truth serum of the market. A price move without trading volume is often a trap.
- Beware the false breakout. True breakouts require closing confirmation and sustained volume, not just a brief intraday spike.
- Context is everything. Single stocks rarely move in isolation; understanding sector rotation and market breadth dictates whether a setup has true momentum.
Why Stock Market Signals Matter More Than Price Moves Alone
- Price: Where the asset is trading.
- Volume: How much capital is participating in the move.
- Time: When the move occurs (e.g., pre-market, opening bell, closing cross).
- Context: The broader market environment, catalysts, and sector health.
Price Action: What Stock Price Movement Can and Cannot Tell You
- The Importance of the Close: Intraday highs and lows represent emotion and volatility. The closing price represents consensus. A stock that spikes 10% intraday but closes flat has printed a massive upper "wick," signaling heavy selling pressure, not strength.
- Gap Ups and Gap Downs: A stock opening significantly higher or lower than its previous close is a powerful signal. Breakaway gaps on high volume often signal the start of a new trend, while exhaustion gaps on low volume usually fade quickly.
- Pre-Market Stock Moves: Pre-market stock moves are notoriously deceptive. Because pre-market liquidity is incredibly low, a small amount of capital can cause a massive percentage swing. The SEC’s Investor Bulletin on After-Hours Trading explicitly warns that pre-market volatility and lack of liquidity do not reliably predict how a stock will trade during regular hours. Never assume a 5% pre-market pop guarantees a strong regular trading session.
Trading Volume: How to Confirm or Question a Price Move
- High Volume on an Uptrend (Confirmation): If a stock is rising and volume is expanding, it signals strong conviction and institutional participation.
- Low Volume on an Uptrend (Warning): If a stock is rising but volume is shrinking, the move lacks conviction. It is vulnerable to a sudden reversal.
- High Volume on a Downtrend (Capitulation/Selling Pressure): Heavy volume on a down day indicates aggressive distribution or panic selling.
- Volume Divergence: If price makes a new high, but the volume is significantly lower than the previous high, this divergence is a classic signal that the trend is running out of steam.
Breakouts and False Breakouts: Why Confirmation Matters
- Closing Confirmation: Do not buy the moment a line is crossed. Wait to see if the stock can close the daily candle above the resistance level.
- Volume Surge: A legitimate breakout must be accompanied by a spike in trading volume. A low-volume breakout is highly suspect.
- The Retest: Often, a stock will break out, pull back to "retest" the old resistance line (which should now act as support), and then continue higher. Buying the successful retest is statistically safer than chasing the initial break.
Sector Rotation: How to Read Market Leadership
- Broad Rally vs. Single Stock: A semiconductor stock breaking out is much more likely to succeed if the broader semiconductor ETF (like the SMH) is also breaking out.
- Identifying Leadership: Are AI and Tech leading the market, or is capital flowing into defensive sectors like Utilities and Consumer Staples? If defensive sectors are leading while tech struggles, the broader market signal is "risk-off," meaning aggressive growth trades are less likely to work.
Common Mistakes When Reading Market Signals
- Trading PnL instead of Price Action: Focusing entirely on your profit/loss percentage rather than what the chart is actually doing.
- Trusting Pre-Market Blindly: Treating low-liquidity pre-market action as a definitive trend without waiting for the opening bell volume to confirm it.
- Ignoring the Macro Environment: Buying a perfect technical breakout on a day when the Federal Reserve is actively raising interest rates or releasing major inflation data.
- Ignoring Volume: Buying a breakout on incredibly thin volume, only to become trapped when sellers step in.
Market Signal Checklist Before Making a Decision
- [ ] Price Action: Has the stock decisively broken out, and has it closed above the key level?
- [ ] Volume: Is the current price move supported by above-average, expanding volume?
- [ ] Catalyst: Is there a clear reason (earnings, news, macro data) driving this move?
- [ ] Sector Rotation: Is the stock's broader sector showing relative strength compared to the S&P 500?
- [ ] Risk Context: If this is a false breakout, where is my exact invalidation level (stop-loss)?
Related Reading
FAQ
Popular Articles
View More
Funding Rate Arbitrage in Crypto: How 0.24% in Fees Eats a Quarter of Your Yield
Funding rate arbitrage is a delta-neutral trade: you buy spot and short the same notional in perpetual futures, then collect the funding payment while price risk cancels out. It is not risk-free. And
U.S. Stocks Weekly Report | Jul 24–30: MSFT Azure Surges 43% vs Meta’s 14% Profit Shrinkage—Mag7 Earnings Wrap Up, AI Winners Emerge?
In July 2026, the full-season earnings reports for the US stock market's Mag7 concluded with a major test of "AI monetization capabilities." Same theme (AI), same group of institutional investors,

Apple (AAPL) Price Target and Stock Price Prediction: Can the Stock Hit $400 When Apple Can't Build Enough?
Key Takeaways Wall Street's consensus Apple price target is $321.66, with individual analyst calls running from $215 to $400. AAPL fell about 6% in extended trading on July 30, 2026, despite Apple

Hot Crypto Updates
View More
Los Angeles Dodgers vs Chicago Cubs Prediction: MLB Preview and Score Forecast
The Los Angeles Dodgers begin a series against the Chicago Cubs at Wrigley Field on August 4, 2026, at 08:05 UTC+8. Chicago is expected to start Matthew Boyd, who enters with a 6–1 record and 3.41

Karmine Corp vs Team Heretics Prediction: LEC 2026 Regular Season Preview
Karmine Corp and Team Heretics meet in a best-of-three LEC Summer regular-season series on August 4, 2026, at 01:15 UTC+8. The official LoL Esports schedule confirms the matchup as part of the LEC

St. Louis Cardinals vs New York Yankees Prediction: MLB Preview, Pitchers and Score Forecast
The St. Louis Cardinals visit Yankee Stadium for the opening game of their MLB series against the New York Yankees on August 4, 2026, at 07:05 UTC+8. Michael McGreevy is scheduled to start for St.

Trending News
View More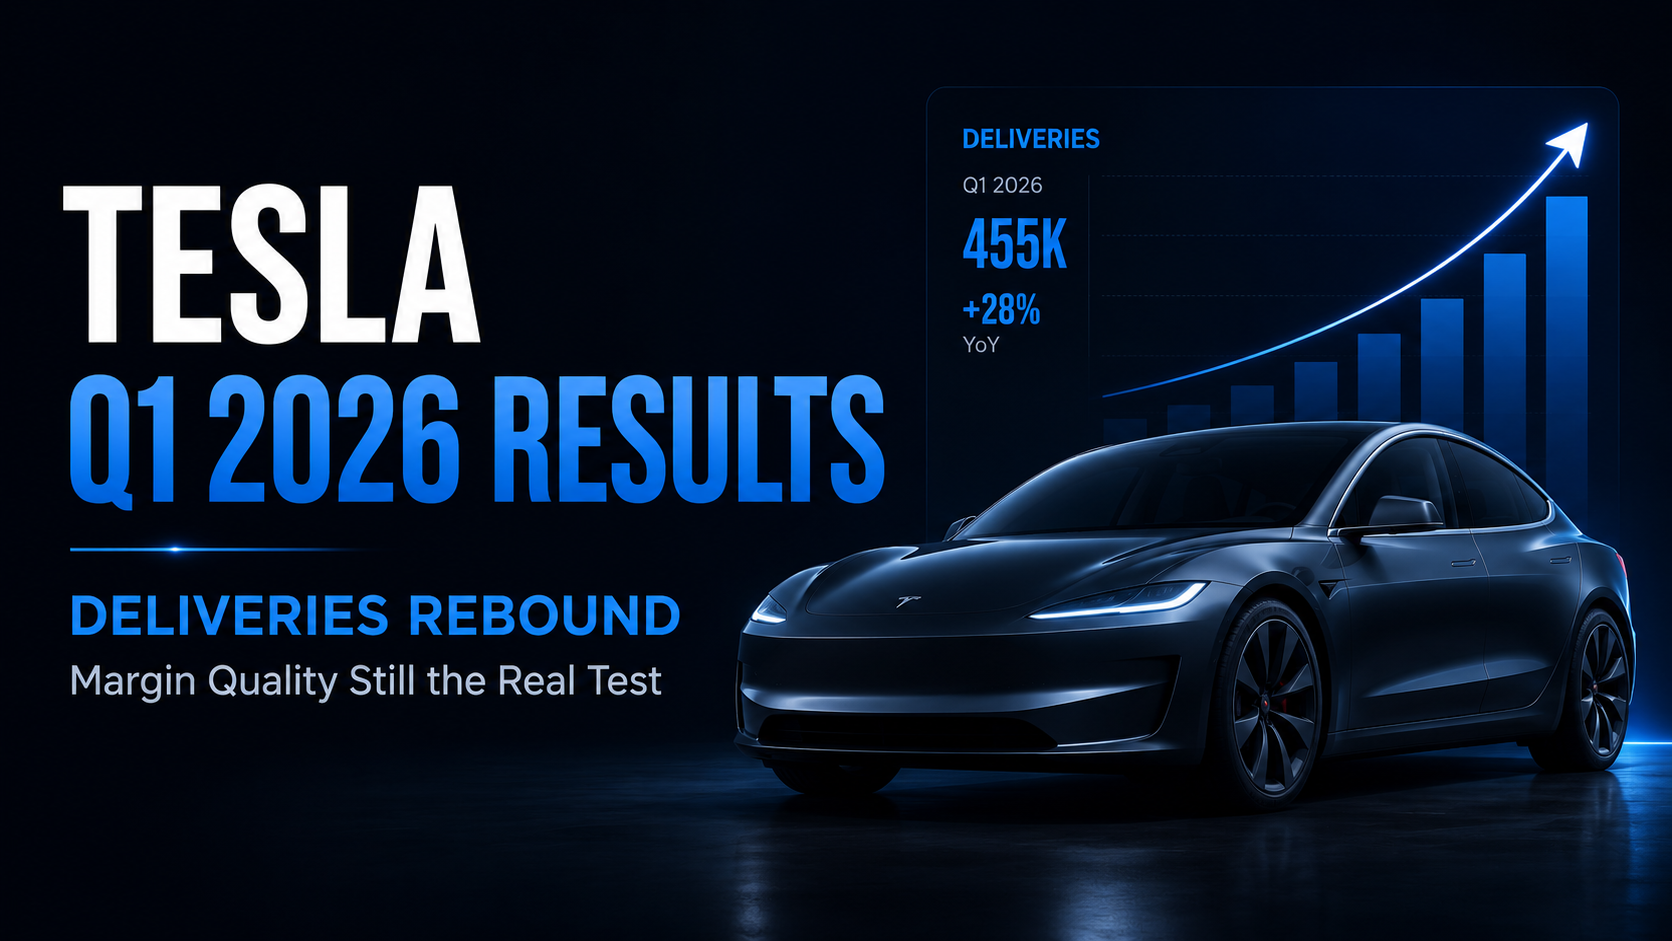
Tesla Q1 2026 Earnings Review: Deliveries Rebounded, But Margin Quality Remains the Real Test
Tesla reported its Q1 2026 financial results on April 22, 2026, after the U.S. market close. The company delivered 358,023 vehicles in the quarter, generated total revenue of $22.4 billion, and report
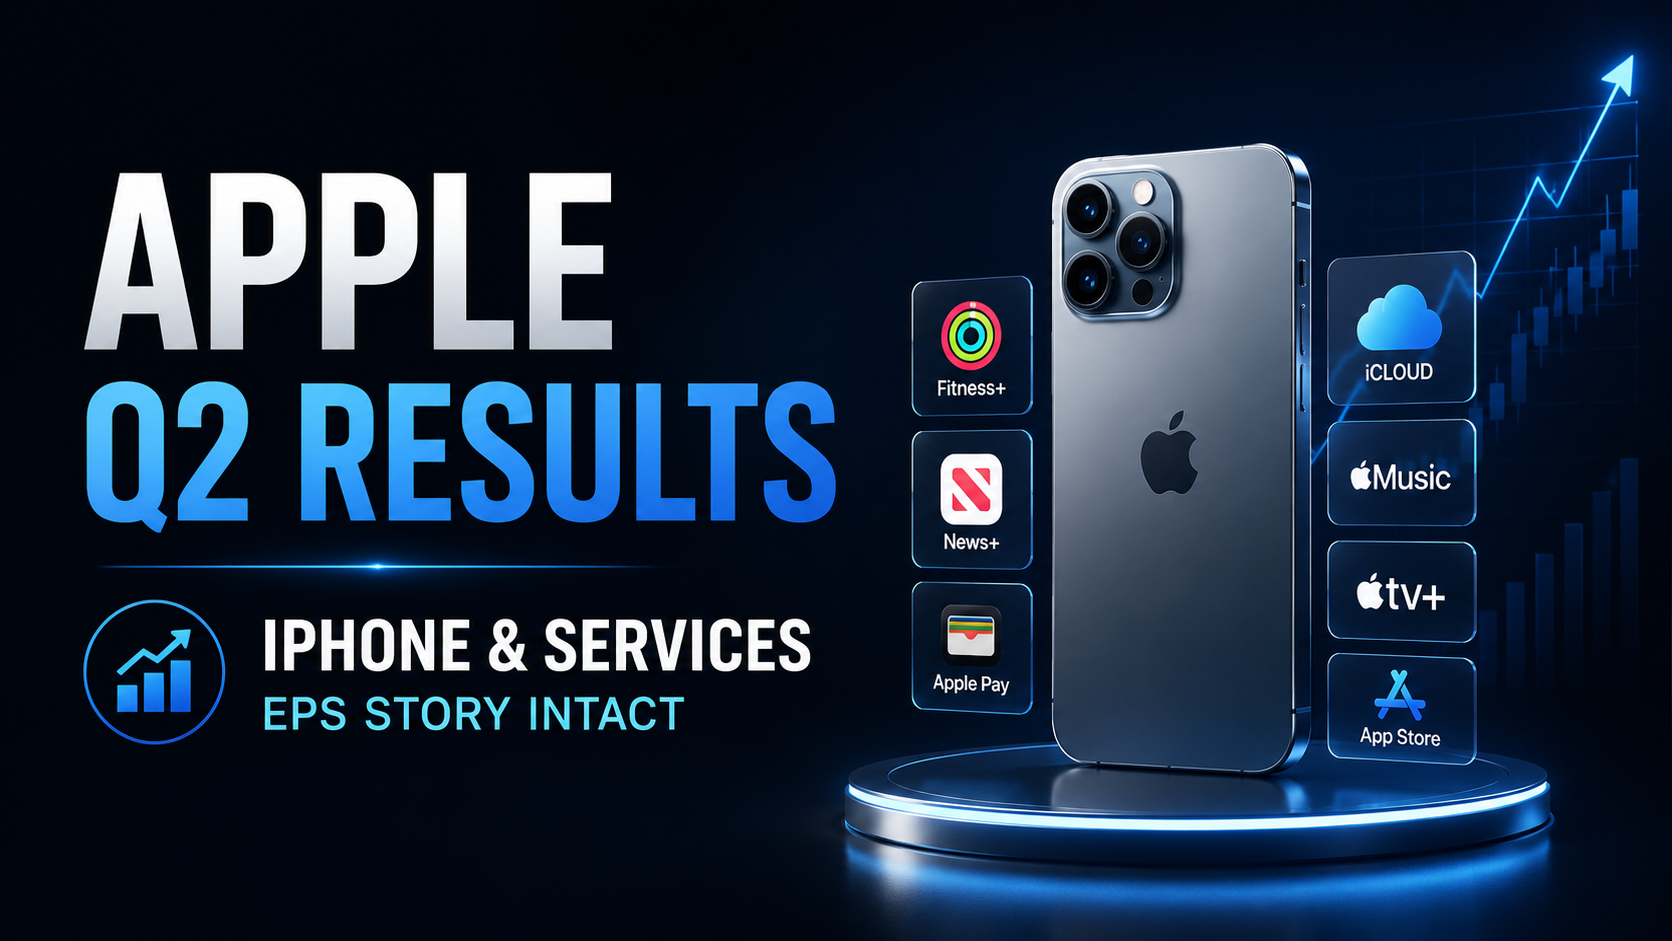
Apple FY2026 Q2 Earnings Review: iPhone Revenue and Services Growth Keep EPS Story Intact
Apple reported fiscal 2026 second-quarter results on April 30, 2026, covering the quarter that ended March 28, 2026. Revenue reached $111.2 billion, up 17% year over year, while diluted EPS rose 22% t

Hyperliquid Open Interest Hits $11.5 Billion: Are On-Chain Perpetuals Expanding into U.S. Equity Markets?
Hyperliquid’s open interest has reached approximately $11.5 billion, a new high for 2026, with HIP-3 markets contributing nearly $4 billion. The S&P 500-linked contract has become the largest HIP-3 ma
Related Articles
View MoreApple (AAPL) Price Target and Stock Price Prediction: Can the Stock Hit $400 When Apple Can't Build Enough?
Key TakeawaysWall Street's consensus Apple price target is $321.66, with individual analyst calls running from $215 to $400.AAPL fell about 6% in extended trading on July 30, 2026, despite Apple posti

MSFT Price Target: Zero Sell Ratings and a $100 Billion Azure Year, So Why Won't Microsoft Stock Close the Gap?
Microsoft (NASDAQ: MSFT) just closed its fiscal year with a quarter that beat Wall Street on every headline number — and the stock still trades roughly 24% below where the average analyst says it shou
Meta Stock Guide: How Ads, AI Spending and Reality Labs Drive META Stock (2026 Updated)
Meta Platforms, traded as META on the Nasdaq, earns almost all of its money from advertising across Facebook, Instagram, and WhatsApp. The debate for investors is whether its enormous AI spending and


