If you've spent any time watching Bitcoin price charts, you've probably seen the letters "RSI" somewhere on the screen. This guide breaks down what the Bitcoin RSI actually measures, how to readIf you've spent any time watching Bitcoin price charts, you've probably seen the letters "RSI" somewhere on the screen. This guide breaks down what the Bitcoin RSI actually measures, how to read
Learn/Learn/Project Spotlight/Bitcoin RSI... Divergence

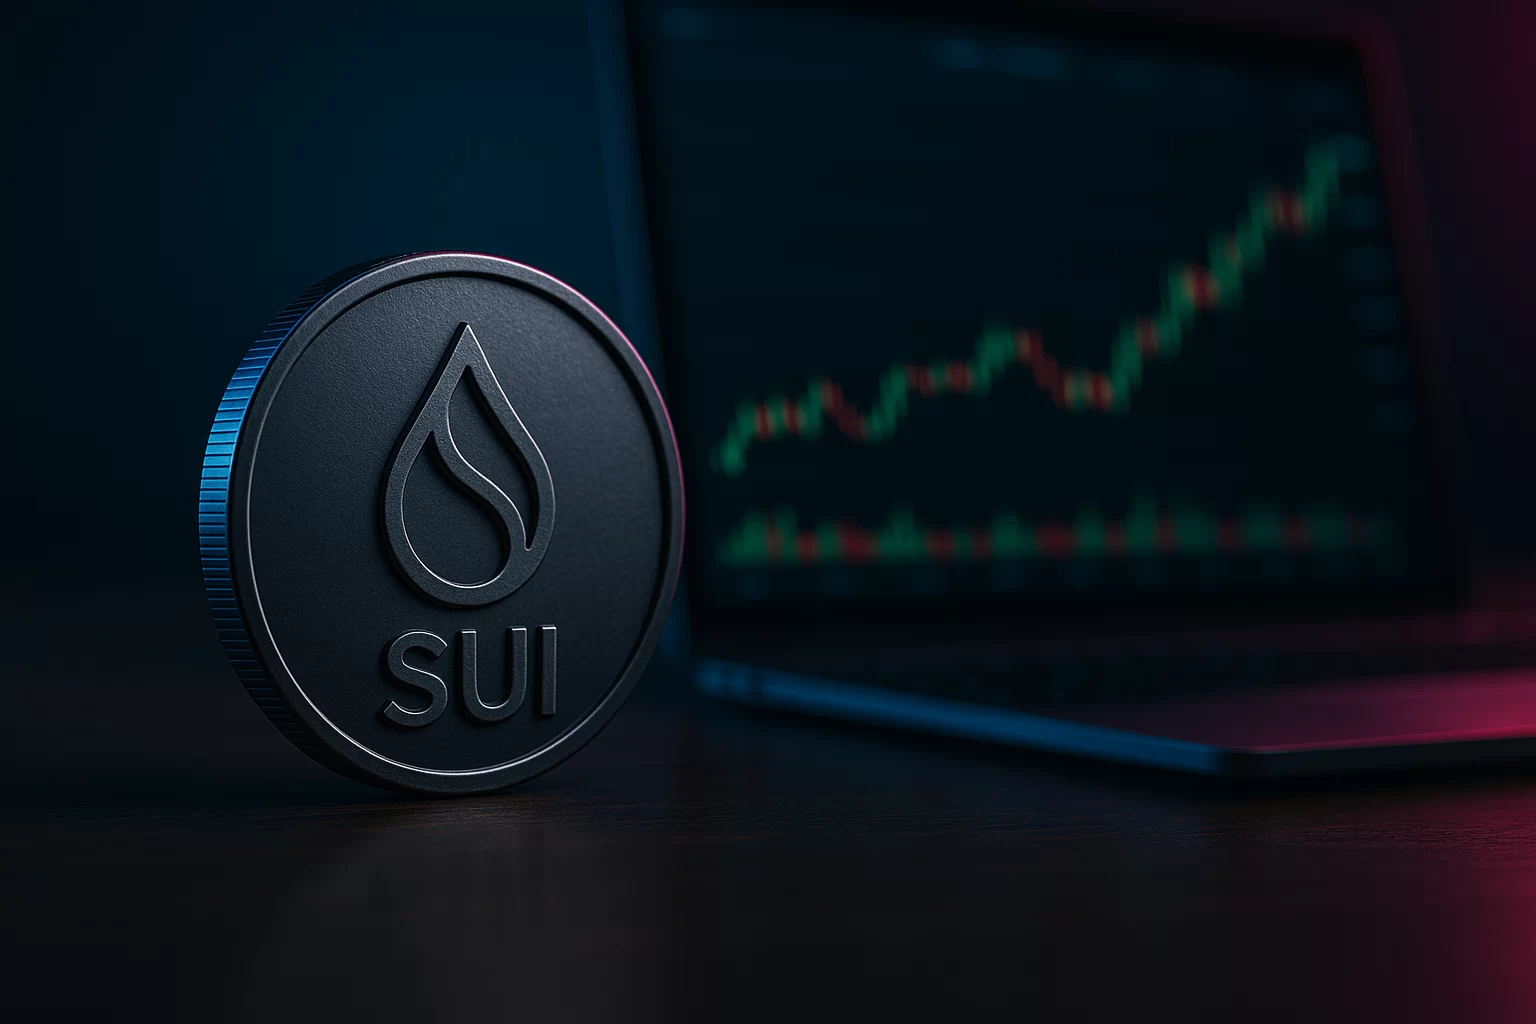
Bitcoin RSI Guide: 14-Day Value, Overbought Levels, and Divergence

Beginner
Jun 4, 2026James Mitchell
0m
4
4$0.008481-7.90%
Bullish Degen
BULLISH$0.0004044-7.33%
Notcoin
NOT$0.0004173-7.73%


If you've spent any time watching Bitcoin price charts, you've probably seen the letters "RSI" somewhere on the screen.
This guide breaks down what the Bitcoin RSI actually measures, how to read overbought and oversold signals, which timeframes matter most, and where to check the current value — everything a beginner needs to use this indicator with confidence.

Key Takeaways
  • The Bitcoin RSI is a momentum oscillator that moves on a scale of 0 to 100, with a default setting of 14 periods.
  • A Bitcoin RSI above 70 signals a potentially overbought market; a reading below 30 suggests oversold conditions.
  • Bitcoin's RSI can stay elevated for extended periods during strong trends, so the 70/30 thresholds should not be used in isolation.
  • The daily RSI(14) is the most widely used timeframe, while the weekly RSI provides broader market cycle context.
  • RSI divergence — when price and RSI move in opposite directions — can be an early warning that the current trend is losing momentum.
  • RSI works best as one part of a broader strategy, not as a standalone buy or sell signal.

What Is the Bitcoin RSI Indicator?

The Bitcoin RSI — short for Relative Strength Index — is a momentum oscillator that measures how fast and how hard Bitcoin's price has moved in one direction over a set period.
It was developed by technical analyst J. Welles Wilder in 1978 and has since become one of the most widely used indicators in crypto trading.
The RSI runs on a scale from 0 to 100.
A high reading means recent price gains have significantly outpaced losses.
A low reading means the opposite — selling pressure has dominated.
By default, most traders and platforms use a 14-period setting, meaning the RSI(14) calculates momentum based on the last 14 candles.
On a daily chart, that's 14 days of price data — which is why you'll often see the term Bitcoin rsi 14-day current value when traders are checking the most common version of this indicator.


Bitcoin RSI Overbought and Oversold Levels: The 70/30 Rule

The Standard 70/30 Thresholds

When RSI climbs above 70, it indicates that buying pressure has been intense enough to push price into potentially overextended territory — a zone where a correction becomes more likely.
When RSI drops below 30, it suggests selling pressure has been excessive, and a stabilization or rebound may be approaching.
These levels don't guarantee a reversal, but they serve as useful early warnings that momentum may be stretched.

Why Bitcoin Plays by Different Rules

Here's the thing most beginner guides skip: Bitcoin doesn't behave like a traditional stock, and the standard 70/30 thresholds don't always apply cleanly.
During strong bull markets, BTC's daily RSI can stay above 70 for weeks — sometimes months — without a meaningful pullback.
Some analysts apply adjusted ranges for Bitcoin's trending nature: during strong bull markets, RSI can remain elevated for extended periods, and a pullback toward the mid-range may be viewed as a momentum pause rather than a reversal signal.
In a bear market, RSI tends to stay in lower ranges, and readings that would signal neutral territory in a bull market can sometimes act as resistance instead.
The practical takeaway is that the market cycle phase matters just as much as the raw RSI number.

RSI Is a Signal, Not a Guarantee

An overbought RSI does not mean Bitcoin will drop tomorrow.
An oversold RSI does not mean Bitcoin will bounce today.
What RSI does is highlight momentum extremes — moments when the market may be running hotter or colder than recent history supports.
Treating RSI as one input among several, rather than a standalone decision trigger, is what separates disciplined traders from reactive ones.

How to Read Bitcoin RSI: Daily, Weekly, and 4-Hour Timeframes

Bitcoin Daily RSI — The Most Reliable Starting Point

The 14-day RSI on the daily chart is the most commonly referenced version of this indicator, and for good reason.
It smooths out short-term noise while still being responsive enough to reflect meaningful shifts in momentum.
Swing traders and longer-term holders typically monitor the Bitcoin daily rsi current value as their primary reference for gauging whether BTC is running hot or cooling down.

Bitcoin Weekly RSI — Reading the Macro Cycle

The Bitcoin weekly rsi zooms further out and gives traders a clearer read on where Bitcoin sits within a broader market cycle.
Weekly RSI readings above 70 near historical cycle tops have coincided with major price peaks in several past Bitcoin market cycles.
A weekly RSI divergence — where price makes new highs but the weekly RSI does not — is a pattern some traders monitor closely, though it does not guarantee a reversal.

Shorter Timeframes — More Noise, More Caution

The Bitcoin 4-hour RSI and Bitcoin RSI 1h readings update more frequently and can be useful for timing entries around support levels, but they produce significantly more false signals.
On a 5-minute or 15-minute chart, RSI can swing from oversold to overbought within hours, making it far less reliable without confirmation from additional indicators like MACD or volume.
As a general rule, the higher the timeframe, the more weight each RSI reading carries.


Bitcoin RSI Divergence: Bearish and Bullish Signals Explained

Bearish RSI Divergence

Bearish divergence occurs when Bitcoin's price makes a higher high, but the RSI makes a lower high at the same time.
This disconnect tells you that while price is still climbing, the momentum driving that climb is weakening.
It doesn't mean a crash is coming, but it does mean the rally may be running out of fuel — a signal worth taking seriously, especially on the daily or weekly chart.

Bullish RSI Divergence

Bullish divergence is the mirror image: Bitcoin's price makes a lower low, but the RSI makes a higher low.
Selling pressure is easing even as price continues to fall, which suggests the downtrend may be losing momentum.
Some analysts have observed bullish divergence on the weekly chart appearing before certain Bitcoin price recoveries, though past patterns do not guarantee future results.

Why Timeframe Matters for Divergence

A divergence spotted on a 5-minute chart is far less meaningful than one showing up on the daily or weekly.
Shorter timeframe divergences resolve quickly and frequently, while higher timeframe divergences reflect deeper structural shifts in market momentum.
When a Bitcoin RSI MACD divergence appears simultaneously across both indicators on the daily chart, it tends to carry the most weight for most traders.

FAQ

What is the Bitcoin RSI?
The Bitcoin RSI (Relative Strength Index) is a momentum indicator that measures the speed and magnitude of BTC price movements on a scale of 0 to 100.
What does a Bitcoin RSI above 70 mean?
An RSI above 70 signals that Bitcoin may be overbought, meaning recent buying pressure could be overextended and a pullback is possible.
What is the Bitcoin 14-day RSI current value?
The Bitcoin rsi 14-day current value changes in real time and can be checked on platforms like TradingView or CoinMarketCap's RSI heatmap.
Is the Bitcoin RSI oversold right now?
An RSI reading below 30 indicates oversold conditions — whether BTC currently meets that threshold depends on the live data at the time of reading.
What is RSI divergence in Bitcoin?
RSI divergence occurs when Bitcoin's price and its RSI move in opposite directions, often signaling that the current trend is losing momentum.
What is the best RSI timeframe for Bitcoin trading?
Most swing traders rely on the 14-period RSI on the daily chart, while the weekly RSI is preferred for reading longer-term market cycle context.


Where to Check the Bitcoin RSI Current Value

Several platforms display the Bitcoin RSI current value in real time across multiple timeframes.
TradingView offers the most flexibility — you can pull up any BTC trading pair, set your preferred timeframe, and add the RSI(14) indicator directly to the chart.
CoinMarketCap's RSI heatmap provides a quick visual overview of where Bitcoin and other major assets currently sit in terms of overbought or oversold readings, without needing to configure a full chart manually.
CoinGlass also tracks the BTC RSI live alongside liquidation data, which can be useful for understanding whether RSI extremes are coinciding with elevated leverage in the market.
When checking RSI, always confirm which timeframe the reading reflects — a daily RSI and a 15-minute RSI on the same day can point in entirely opposite directions.
For live BTC prices and market data, trade Bitcoin on MEXC to track market conditions alongside your RSI analysis.

Conclusion

The Bitcoin RSI is one of the most practical tools a trader can learn, but it works best when treated as part of a broader strategy rather than a standalone buy or sell signal.
Reading overbought and oversold levels correctly, understanding how Bitcoin-specific behavior differs from textbook rules, and monitoring divergence across multiple timeframes are what turn a basic RSI check into a genuinely useful trading input.
Start with the daily RSI(14), layer in the weekly for cycle context, and always confirm with at least one additional indicator before acting.


Market Opportunity
4 Logo
4 Price(4)
$0.008481
$0.008481$0.008481
-5.16%
USD
4 (4) Live Price Chart

Popular Articles

View More
Who Is Kevin Warsh? Is He Hawkish or Dovish? What the New Fed Chair's Monetary Policy Views Mean for Market

Who Is Kevin Warsh? Is He Hawkish or Dovish? What the New Fed Chair's Monetary Policy Views Mean for Market

Kevin Warsh is chairing his first Federal Open Market Committee meeting today as the 17th Federal Reserve Chair, and every market from Bitcoin to the Nasdaq is watching his next move. Bitcoin has

Could CRWV Climb to $140 or Higher? CoreWeave Price Target and Analyst Forecast

Could CRWV Climb to $140 or Higher? CoreWeave Price Target and Analyst Forecast

CoreWeave has turned into one of the most argued-about stocks on Wall Street this year. One week it jumps double digits on an Nvidia chip announcement. The next, it slides after a multibillion-dollar

Will IREN Reach $100 After Its 725% Rally? The Full Analyst Price Target Breakdown

Will IREN Reach $100 After Its 725% Rally? The Full Analyst Price Target Breakdown

IREN Limited (NASDAQ: IREN) has surged roughly 725% from its 52-week low to trade near $60 in mid-June 2026, turning a niche bitcoin miner into one of Wall Street's most-watched AI infrastructure

The Complete Guide to Coin-M Perpetual Futures on MEXC

The Complete Guide to Coin-M Perpetual Futures on MEXC

In cryptocurrency derivatives, Futures trading enables investors to apply leverage to increase potential returns and to take positions in both rising and falling markets. MEXC offers two primary

Hot Crypto Updates

View More
XRPL 3.2.0 Is Live: The End of rippled, and What XRP Holders Actually Need to Do

XRPL 3.2.0 Is Live: The End of rippled, and What XRP Holders Actually Need to Do

XRP Ledger's v3.2.0 mainnet upgrade activated on June 15, 2026, renaming the core server software from rippled to xrpld and cutting node memory usage by up to 40%. Here's what it means for XRP

US-Iran Peace Framework: How Falling Oil Prices Are Boosting Crypto Liquidity

US-Iran Peace Framework: How Falling Oil Prices Are Boosting Crypto Liquidity

On June 15, 2026, the United States and Iran announced a preliminary peace framework agreement aimed at ending months of military conflict and reopening the Strait of Hormuz, one of the most

UK FCA Proposes Limited Crypto Exposure for Retail Investment Funds: Here's What You Need to Know

UK FCA Proposes Limited Crypto Exposure for Retail Investment Funds: Here's What You Need to Know

1.Introduction The United Kingdom financial regulator is considering a significant policy shift that could expand access to cryptocurrency-linked investments for everyday investors. The Financial

ZEC Plunges on Infinite Mint Fears: Analyzing the Market Fallout of the Orchard Bug

ZEC Plunges on Infinite Mint Fears: Analyzing the Market Fallout of the Orchard Bug

Overview Zcash (ZEC) lost roughly half its value in 48 hours in early June 2026, falling from a June 4 peak near $624 to about $309 on June 5 after Shielded Labs disclosed a critical soundness flaw

Trending News

View More
Top 4 Cryptos to Watch in 2026: BlockDAG, Zcash, XRP, & Solana Lead the Market

Top 4 Cryptos to Watch in 2026: BlockDAG, Zcash, XRP, & Solana Lead the Market

Compare why BlockDAG's 5,000 TPS architecture & fixed $0.10 buyback guarantee position it as the top crypto to watch over Zcash, XRP, & Solana.

4 held over gang rape of teen in Lahad Datu

4 held over gang rape of teen in Lahad Datu

The suspects, in their 20s, allegedly raped the 14‑year‑old victim while she was asleep in her room.

USMNT vs Australia 2026 World Cup Prediction: Can Pulisic’s Hosts Handle the Socceroos’ Momentum?

USMNT vs Australia 2026 World Cup Prediction: Can Pulisic’s Hosts Handle the Socceroos’ Momentum?

The United States and Australia meet in a major Group D fixture at the FIFA World Cup 2026, with both teams entering the match full of confidence after winning their opening games. The United States s

SUI trading volume hits 398 million dollars! What does the new compliance move mean for the market?

SUI trading volume hits 398 million dollars! What does the new compliance move mean for the market?

🚀 SUI trading volume soared to 398 million dollars in 24 hours. 📉 Despite a 4.26 percent price drop, analysts highlight signals of renewed strength. 🏦 A new compliance

Related Articles

View More
Bitcoin Mining Farm Explained: ASIC Miners, Costs, and How BTC Gets Made

Bitcoin Mining Farm Explained: ASIC Miners, Costs, and How BTC Gets Made

If you've ever wondered where Bitcoin actually comes from, the answer starts inside a Bitcoin mining farm.These are industrial-scale facilities packed with thousands of specialized computers running a

Does Vanguard Have a Bitcoin ETF? What Investors Need to Know

Does Vanguard Have a Bitcoin ETF? What Investors Need to Know

Vanguard is one of the world's largest asset managers — and for years, it wanted nothing to do with Bitcoin.That changed in December 2025, when the firm reversed course and opened its brokerage platfo

Best Bitcoin Trading Platform: Key Features, Fees, and Security Explained

Best Bitcoin Trading Platform: Key Features, Fees, and Security Explained

Not every Bitcoin trading platform is built the same — and for beginners, picking the wrong one can mean paying too much in fees, dealing with poor security, or getting lost in a confusing interface b

Bitcoin Support Resistance Levels: How to Identify and Trade Key BTC Price Zones

Bitcoin Support Resistance Levels: How to Identify and Trade Key BTC Price Zones

Whether you're a day trader watching the 15-minute chart or a long-term holder tracking weekly structure, understanding Bitcoin support and resistance levels is one of the most practical skills you ca

Sign Up on MEXC
Sign Up & Receive Up to 10,000 USDT Bonus
Predict World Cup, Share 8M USDT
Predict World Cup, Share 8M USDTPredict World Cup, Share 8M USDT
Share 200K USDT daily. Win more with streaks