The correlation between Bitcoin (BTC) and gold has snapped under the pressure of the Iran conflict, according to a note to investors by JPMorgan. While geopolitThe correlation between Bitcoin (BTC) and gold has snapped under the pressure of the Iran conflict, according to a note to investors by JPMorgan. While geopolit

JPMorgan Flags Sharp Divergence Between Bitcoin and Gold ETF Flows Since Iran War

2026/03/13 18:52
4분 읽기
이 콘텐츠에 대한 의견이나 우려 사항이 있으시면 crypto.news@mexc.com으로 연락주시기 바랍니다

The correlation between Bitcoin (BTC) and gold has snapped under the pressure of the Iran conflict, according to a note to investors by JPMorgan.

While geopolitical instability usually drives a unified bid for safe havens, the two assets are currently moving in opposite directions.

This decoupling reveals a significant shift in how capital is treating “digital gold” versus the real thing.

Instead of moving in tandem as crisis hedges, investors are aggressively rotating capital, creating a clear winner in the ETF market since late February.

Discover: The best crypto to buy now

What the JPMorgan ETF Flow Data Actually Shows About Bitcoin

Since the conflict escalated on Feb. 27, JPMorgan analysts report a stark divergence in capital flows. The largest gold ETF, SPDR Gold Shares (GLD), has bled outflows totaling roughly 2.7% of its assets under management.

In contrast, BlackRock’s iShares Bitcoin Trust (IBIT) absorbed inflows equaling roughly 1.5% of its assets during the same window.

JPMorgan analysts, led by Managing Director Nikolaos Panigirtzoglou, highlighted in their recent note to investors that this reverses the trend seen earlier in the year when gold funds held the advantage.

The data is unambiguous. While gold has traditionally been the default safety trade during Middle East tensions, capital is currently voting for Bitcoin exposure.

Institutional positioning generally reflects a shift away from bullion in favor of the spot Bitcoin ETFs, despite the higher volatility inherent in crypto assets.

Interestingly, IBIT inflows since the start of 2024 are now roughly double the total accumulation seen by GLD, further cementing the shift in dominance among exchange-traded products.

Is Bitcoin Replacing Gold as the Crisis Hedge?

The divergence goes deeper than headline flows. JPMorgan notes that while spot Bitcoin ETFs are seeing inflows, institutional derivatives markets paint a more cautious picture. Hedge funds appear to be reducing direct Bitcoin exposure even as ETF buyers step up.

Short interest in IBIT has actually increased since the conflict began, while GLD short interest declined. This narrows the gap between the two, suggesting that hedge funds are hedging their crypto bets while favoring gold for pure defensive positioning.

This creates a complex market structure. Retail and registered investment advisors (RIAs) are likely driving the ETF bid, treating Bitcoin as a risk-off asset alongside the dollar. Meanwhile, sophisticated desks are hedging downside risk as oil surges past $100, a macro factor that typically pressures risk assets.

Options activity supports this cautious institutional stance. The demand for downside protection in Bitcoin has risen, contrasting with the relentless buying pressure in the spot ETF market. However, the sheer magnitude of the rotation, selling gold to buy Bitcoin, suggests the “digital gold” narrative is holding up under fire better than skeptics anticipated.

Bitcoin Price Prediction: Can BTC Hold the $70,000 Level?

Price action remains resilient despite the mixed signals from derivatives markets. Even with war-driven inflation fears dominating the headlines, Bitcoin is trading above $70,000, showing strength where legacy assets have faltered.
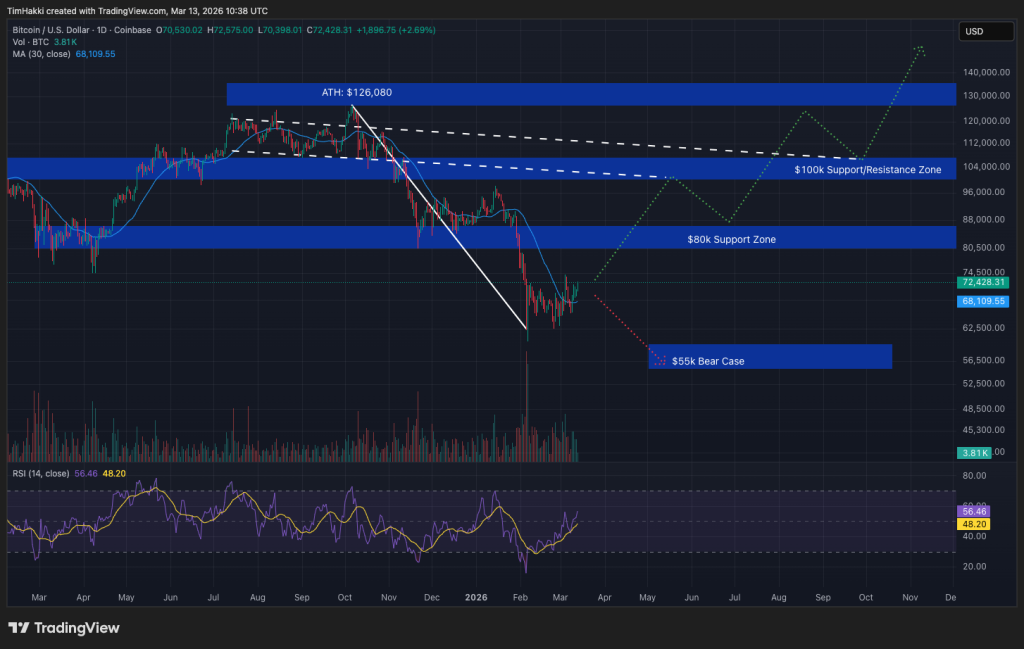
JPMorgan Flags Sharp Divergence Between Bitcoin and Gold ETF Flows Since Iran WarSource: TradingView

Bull Scenario: If ETF inflows persist at this 1.5% pace, Bitcoin targets the $80,000 resistance band. Clearing that level opens the path to retest all-time highs. JPMorgan’s own valuation models have previously flagged Bitcoin as undervalued relative to gold regarding volatility-adjusted capital, suggesting room for an upside squeeze.

Bear Scenario: Should macro liquidity tighten further, support sits firm at $64,000. A break below this level would validate the rising short interest and likely force a flush of the recent leverage. Traders must watch the $70,000 midpoint closely; losing it would signal that the safe-haven bid has exhausted itself.

The next major catalyst isn’t just on the chart; it’s at the Federal Reserve. If oil prices stay high, inflationary pressure could force central banks to keep rates elevated longer, testing the resilience of both gold and Bitcoin.

Discover: The next crypto to explode

World Cup Combo: Aim for 200x

World Cup Combo: Aim for 200xWorld Cup Combo: Aim for 200x

Combine up to 20 World Cup matches in one order

면책 조항: 본 사이트에 재게시된 글들은 공개 플랫폼에서 가져온 것으로 정보 제공 목적으로만 제공됩니다. 이는 반드시 MEXC의 견해를 반영하는 것은 아닙니다. 모든 권리는 원저자에게 있습니다. 제3자의 권리를 침해하는 콘텐츠가 있다고 판단될 경우, crypto.news@mexc.com으로 연락하여 삭제 요청을 해주시기 바랍니다. MEXC는 콘텐츠의 정확성, 완전성 또는 시의적절성에 대해 어떠한 보증도 하지 않으며, 제공된 정보에 기반하여 취해진 어떠한 조치에 대해서도 책임을 지지 않습니다. 본 콘텐츠는 금융, 법률 또는 기타 전문적인 조언을 구성하지 않으며, MEXC의 추천이나 보증으로 간주되어서는 안 됩니다.

추천 콘텐츠

Ethereum koers toont zeldzaam dubbel koopsignaal en richt zich op $4.550

Ethereum koers toont zeldzaam dubbel koopsignaal en richt zich op $4.550

Connect met Like-minded Crypto Enthusiasts! Connect op Discord! Check onze Discord   Ethereum laat op de uurgrafiek twee opeenvolgende TD Sequential koopsignalen zien. Deze indicator meet uitputting in een trend en geeft vaak een signaal dat de verkoopdruk kan afnemen. Dit dubbele signaal verschijnt rond het niveau van $4.516, waar de ETH prijs kortstondig steun vindt. Dit type formatie komt zelden voor en wordt daarom extra nauwlettend gevolgd. Wat gaat de Ethereum koers hiermee doen? Ethereum koers test steun rond $4.516 De scherpe daling van de Ethereum koers vanaf de prijszone rond $4.800 bracht de ETH prijs in korte tijd naar ongeveer $4.516. Op dit niveau trad duidelijke koopactiviteit op, waardoor de neerwaartse beweging tijdelijk werd gestopt. Het dubbele signaal dat door de TD Sequential indicator is gegenereerd, viel precies samen met dit prijspunt. De TD Sequential is opgebouwd uit negen candles die een trend meetellen. Wanneer de negende candle verschijnt, kan dit duiden op een trendomslag. In dit geval verschenen zelfs twee signalen kort na elkaar, wat aangeeft dat de verkoopdruk mogelijk uitgeput is. Het feit dat dit gebeurde in een zone waar ETH kopers actief bleven, maakt het patroon extra opvallend. TD Sequential just flashed two buy signals for Ethereum $ETH! pic.twitter.com/JPO8EhiEPi — Ali (@ali_charts) September 16, 2025 Welke crypto nu kopen?Lees onze uitgebreide gids en leer welke crypto nu kopen verstandig kan zijn! Welke crypto nu kopen? Fed-voorzitter Jerome Powell heeft aangekondigd dat de rentes binnenkort zomaar eens omlaag zouden kunnen gaan, en tegelijkertijd blijft BlackRock volop crypto kopen, en dus lijkt de markt klaar om te gaan stijgen. Eén vraag komt telkens terug: welke crypto moet je nu kopen? In dit artikel bespreken we de munten die… Continue reading Ethereum koers toont zeldzaam dubbel koopsignaal en richt zich op $4.550 document.addEventListener('DOMContentLoaded', function() { var screenWidth = window.innerWidth; var excerpts = document.querySelectorAll('.lees-ook-description'); excerpts.forEach(function(description) { var excerpt = description.getAttribute('data-description'); var wordLimit = screenWidth wordLimit) { var trimmedDescription = excerpt.split(' ').slice(0, wordLimit).join(' ') + '...'; description.textContent = trimmedDescription; } }); }); Technische indicatoren schetsen herstelkans voor ETH Naast de dubbele koopsignalen verstrekken ook andere indicatoren belangrijke aanwijzingen. Tijdens de daling van de ETH koers waren grote rode candles zichtbaar, maar na de test van $4.516 stabiliseerde de Ethereum koers. Dit wijst op een mogelijke verschuiving in het evenwicht tussen de bears en bulls. Als deze opwaartse beweging doorzet, liggen de eerste weerstanden rond $4.550. Daarboven wacht een sterkere zone rond $4.650. Deze niveaus zijn in eerdere Ethereum sessies al meerdere keren getest. Een doorbraak zou ruimte openen richting de all-time high van ETH rond $4.953. Wanneer de prijs toch opnieuw onder $4.516 zakt, liggen er zones rond $4.500 en $4.450 waar grotere kooporders worden verwacht. Deze niveaus kunnen als een vangnet fungeren, mocht de druk opnieuw toenemen. Marktdynamiek bevestigt technische indicatoren De huidige situatie volgt op een bredere correctie in de cryptomarkt. Verschillende vooraanstaande crypto tokens zagen scherpe koersdalingen, waarna traders op zoek gingen naar signalen voor een mogelijke ommekeer. Dat juist Ethereum nu een dubbel TD Sequential signaal toont, versterkt de interesse in dit scenario. Fundamenteel blijft Ethereum sterk. Het aantal ETH tokens dat via staking is vastgezet, blijft groeien. Dat verkleint de vrije circulatie en vermindert verkoopdruk. Tegelijk blijft het netwerk intensief gebruikt voor DeFi, NFT’s en stablecoins. Deze activiteiten zorgen voor een stabiele vraag naar ETH, ook wanneer de prijs tijdelijk onder druk staat. Fundamentele drijfveren achter de Ethereum koers De Ethereum koers wordt echter niet alleen bepaald door candles en patronen, maar ook door bredere factoren. Een stijgend percentage van de totale ETH supply staat vast in staking contracten. Hierdoor neemt de liquiditeit op exchanges af. Dit kan prijsschommelingen versterken wanneer er plotseling meer koopdruk ontstaat. Daarnaast is Ethereum nog steeds het grootste smart contract platform. Nieuwe standaarden zoals ERC-8004 en ontwikkelingen rond layer-2 oplossingen houden de activiteit hoog. Deze technologische vooruitgang kan de waardepropositie ondersteunen en zo indirect bijdragen aan een ETH prijsherstel. Het belang van de korte termijn dynamiek De komende handelsdagen zullen duidelijk maken of de bulls genoeg kracht hebben om door de weerstandszone rond $4.550 te breken. Voor de bears ligt de focus juist op het verdedigen van de prijsregio rond $4.516. De whales, die met grote handelsorders opereren, kunnen hierin een beslissende rol spelen. Het dubbele TD Sequential signaal blijft hoe dan ook een zeldzame gebeurtenis. Voor cryptoanalisten vormt het een objectief aanknopingspunt om de kracht van de huidige Ethereum trend te toetsen. Vooruitblik op de ETH koers Ethereum liet twee opeenvolgende TD Sequential signalen zien op de uurgrafiek, iets wat zelden voorkomt. Deze formatie viel samen met steun rond $4.516, waar de bulls actief werden. Als de Ethereum koers boven dit niveau blijft, kan er ruimte ontstaan richting $4.550 en mogelijk $4.650. Zakt de prijs toch opnieuw onder $4.516, dan komen $4.500 en $4.450 in beeld als nieuwe steunzones. De combinatie van zeldzame indicatoren en een sterke fundamentele basis maakt Ethereum interessant voor zowel technische als fundamentele analyses. Of de bulls het momentum echt kunnen overnemen, zal blijken zodra de Ethereum koers de eerstvolgende weerstanden opnieuw test. Koop je crypto via Best Wallet Best wallet is een topklasse crypto wallet waarmee je anoniem crypto kan kopen. Met meer dan 60 chains gesupport kan je al je main crypto coins aanschaffen via Best Wallet. Best wallet - betrouwbare en anonieme wallet Best wallet - betrouwbare en anonieme wallet Meer dan 60 chains beschikbaar voor alle crypto Vroege toegang tot nieuwe projecten Hoge staking belongingen Lage transactiekosten Best wallet review Koop nu via Best Wallet Let op: cryptocurrency is een zeer volatiele en ongereguleerde investering. Doe je eigen onderzoek. Het bericht Ethereum koers toont zeldzaam dubbel koopsignaal en richt zich op $4.550 is geschreven door Dirk van Haaster en verscheen als eerst op Bitcoinmagazine.nl.
공유하기
Coinstats2025/09/17 23:31
UK Gilt Yields Spike As Burnham Win Opens Door To Oust Starmer

UK Gilt Yields Spike As Burnham Win Opens Door To Oust Starmer

UK Gilt Yields Spike As Burnham Win Opens Door To Oust Starmer The odds of embattled UK Prime Minister Keir Starmer being ousted by the end of July
공유하기
ZeroHedge2026/06/19 21:05
HashKey Capital’s Strategic $540K STO Deposit to Binance Reveals Institutional Crypto Moves Amid Market Turmoil

HashKey Capital’s Strategic $540K STO Deposit to Binance Reveals Institutional Crypto Moves Amid Market Turmoil

BitcoinWorld HashKey Capital’s Strategic $540K STO Deposit to Binance Reveals Institutional Crypto Moves Amid Market Turmoil Institutional cryptocurrency investment
공유하기
bitcoinworld2026/04/02 18:15

Score Your Share of 50K USDT

Score Your Share of 50K USDTScore Your Share of 50K USDT

Complete DEX+ tasks to unlock the Champion Wheel