

Sandisk Jumped 11% Near a Record. Can the Rally Survive the June 22 Western Digital Swap?
Key Stats for Sandisk Stock
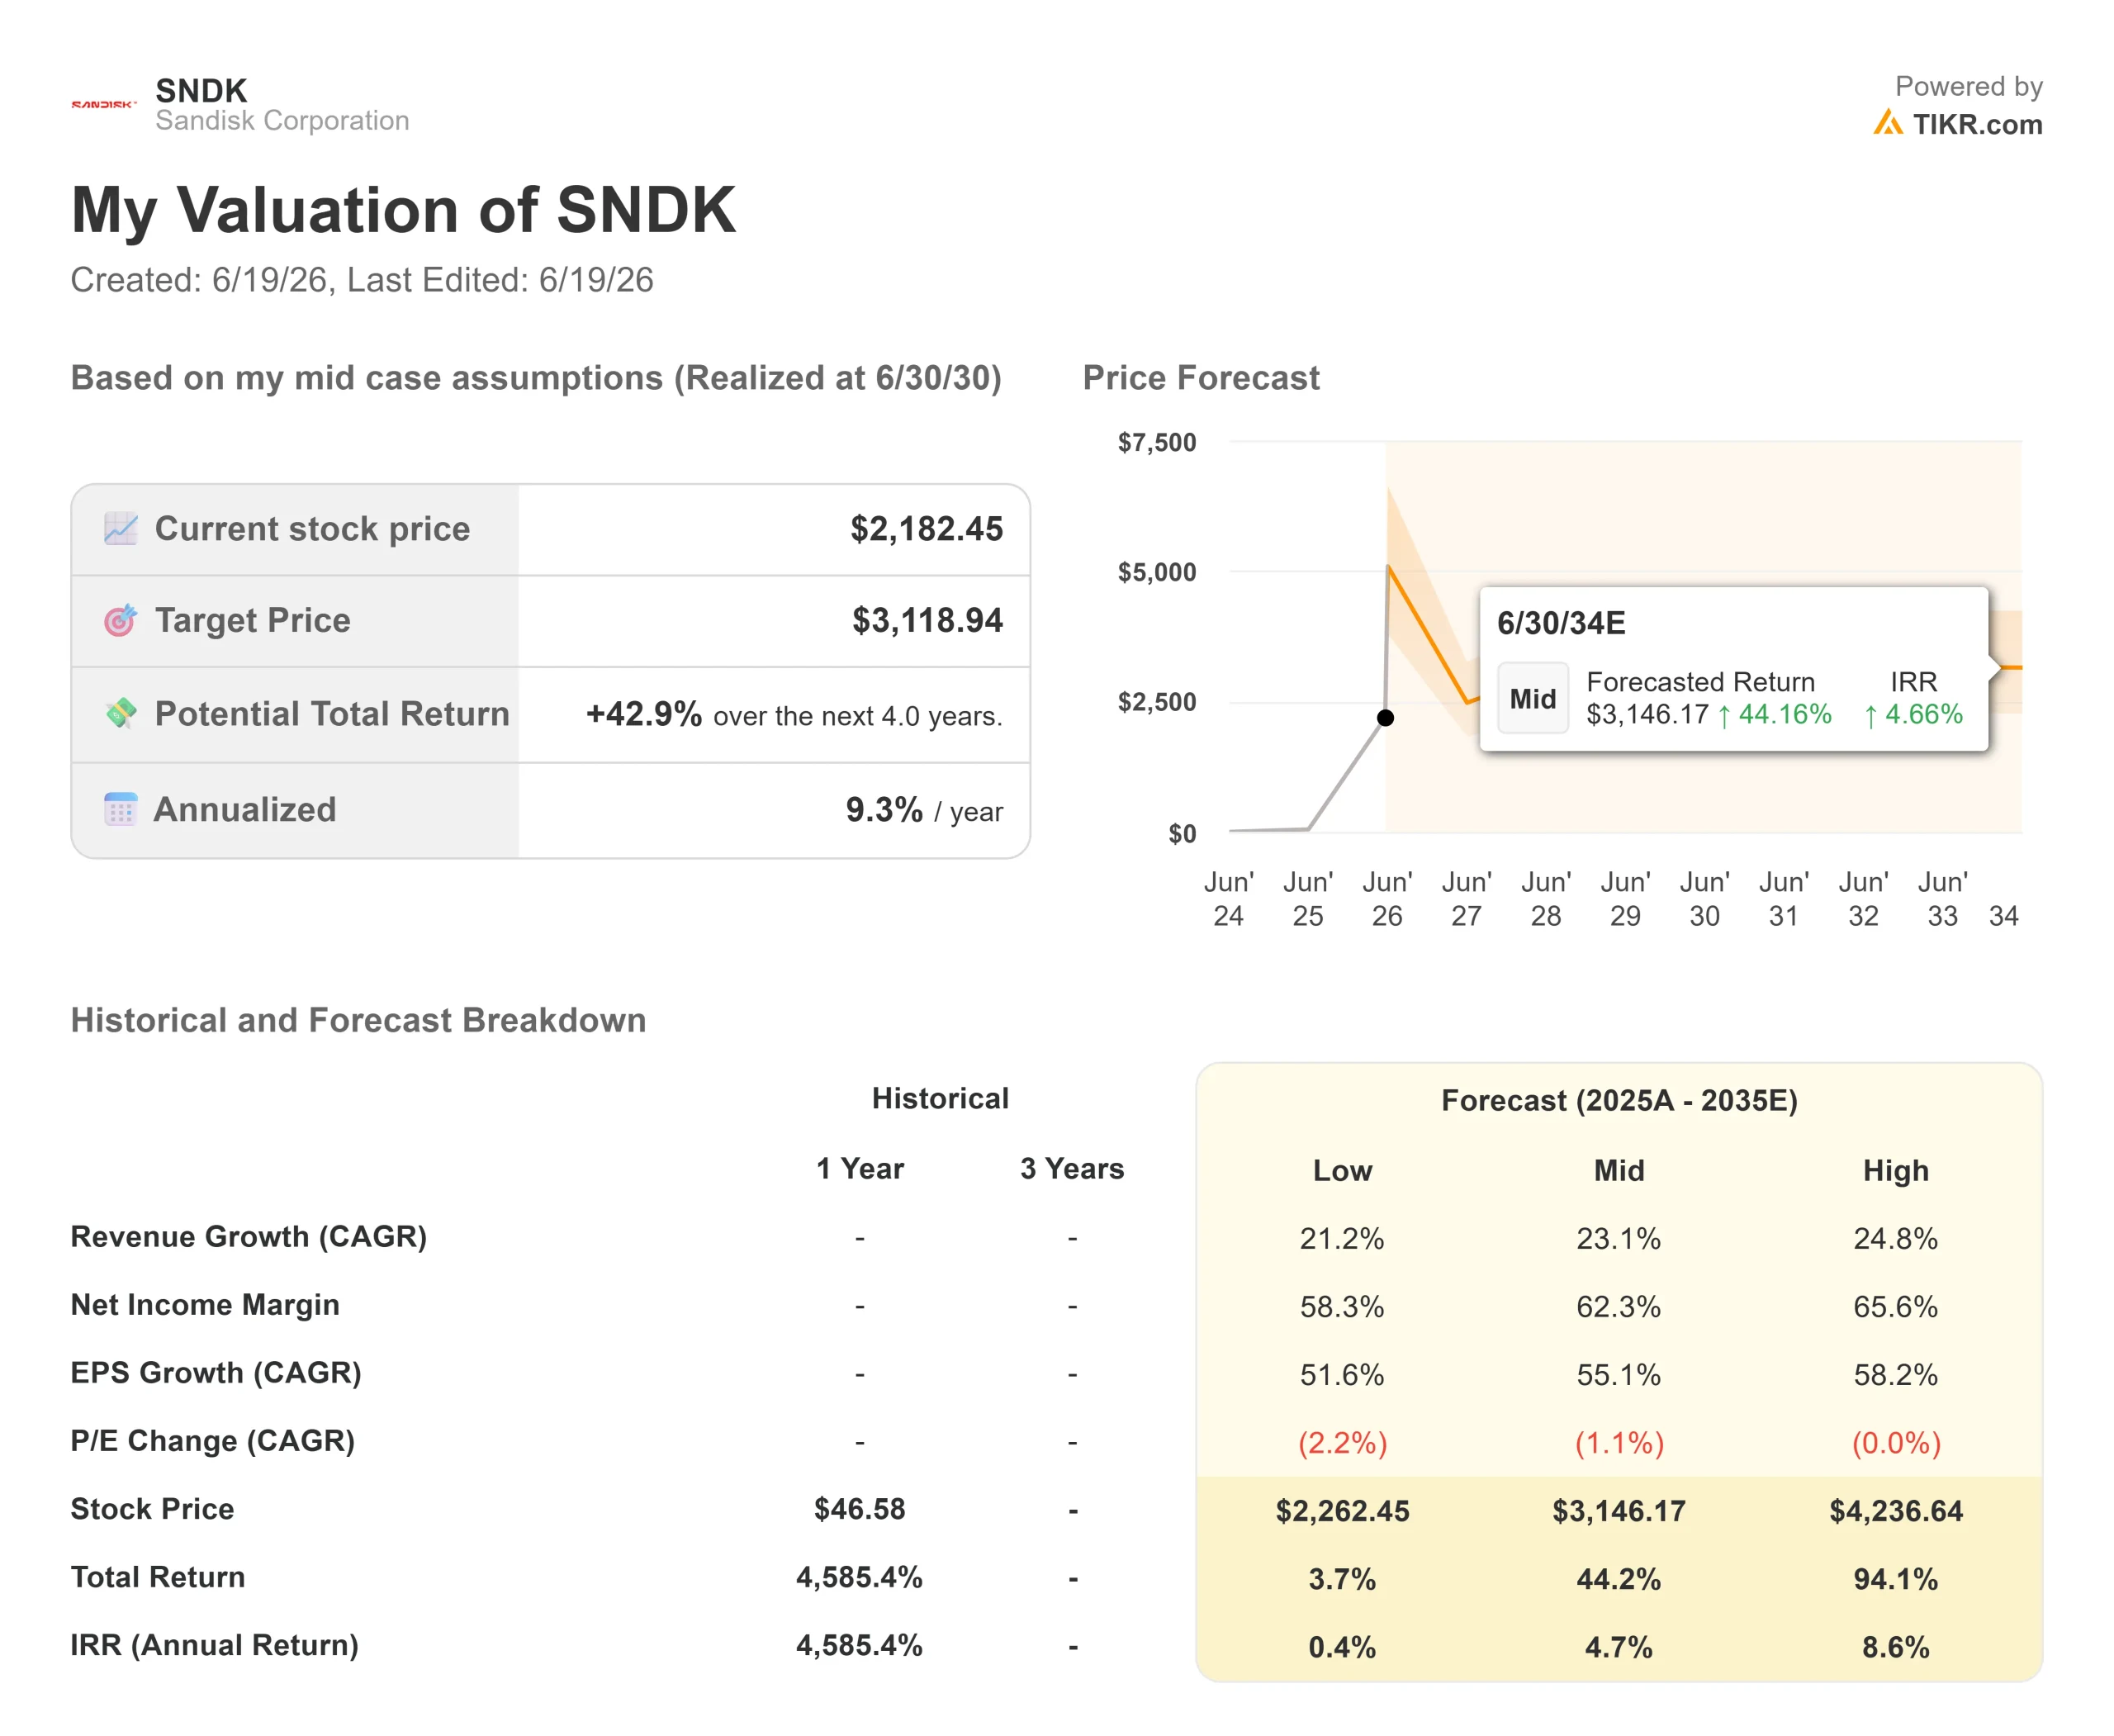
- Current Price: $2,182.45 (June 18, 2026 close)
- Target Price (Mid): ~$3,120
- Street Target: ~$1,750
- Potential Total Return: ~43%
- Annualized IRR: ~9% / year
- Earnings Reaction: +8.25% (April 30, 2026 report)
Now Live: Discover how much upside your favorite stocks could have using TIKR’s new Valuation Model (It’s free) >>>
What Happened?
Sandisk Corporation (SNDK) closed at $2,182.45 on June 18, up 11.42% in a single session and just below its record high of $2,191.69. The move came without company-specific news, as one date crept closer on every shareholder’s calendar: June 22, when former parent Western Digital completes a swap of its last remaining Sandisk shares.
That is the tension. The business looks strong, the chart has gone vertical, and the Street’s average target still sits below the price. Bulls see a structurally repriced memory company with years of demand ahead. Bears see a commodity business priced for perfection just as its former owner heads for the exit. The question no one can answer yet: is the swap a real overhang, or a non-event that clears the last piece of spinoff baggage?
 Sandisk Drawdowns (TIKR)
What Happens on June 22
Western Digital agreed on June 11 to exchange 1,038,681 Sandisk shares for its own stock in private deals with institutional investors. The ratio is set by both stocks’ volume-weighted average prices over June 16 to 18, and the deal is expected to close on June 22. It is the last Sandisk stock Western Digital has held since the February 2025 spinoff.
Bears read a former parent exiting near a record as a signal. Bulls note the shares move privately to institutions, so the supply never hits the open market the way a secondary offering would. Either way, the date is now a known catalyst, which is part of why volatility has picked up around it. The move also lands on a stock that ran from a 52-week low of $40.10 to $2,191.69 in the same 12 months, a range that makes every catalyst feel outsized.
See historical and forward estimates for Sandisk stock (It’s free!) >>>
Why the Stock Ran
The rally is built on a NAND flash shortage, meaning a shortage of the storage chips data centers need, colliding with AI demand. Management has described demand running ahead of supply, with pricing firm as buyers compete for limited capacity.
At the Mizuho Technology Conference on June 9, CEO David V. Goeckeler reframed the company. “Data center has now become, or is quickly becoming the largest market in NAND,” he said. That shifts Sandisk from a consumer storage supplier toward an AI infrastructure supplier, which is a different multiple conversation.
The second pillar is contract structure. CFO Luis Felipe Visoso described what management calls new business models: multi-year supply agreements with fixed and floor-to-ceiling pricing. “Even in the low end prices, we like the margins,” Visoso said. That is the heart of the bull case. If margins hold when pricing softens, the boom-bust pattern that has defined memory breaks.
The Cyclicality Question
The bears have a real argument, and management knows it. Memory is the most cyclical corner of semiconductors, which is why it carries a low multiple. Goeckeler did not dodge it: “Whenever you bring up the word LTA, the first thing they say, they won’t work,” he said, referring to the scar tissue investors carry from past down-cycles.
His answer was a track record, not a promise: “It’s very hard to disprove something except you just keep putting points on the board.” The numbers back him for now. Sandisk’s April 30 report beat consensus revenue by about 26% and adjusted EPS by about 60%, and the stock rose 8.25% that day, its fifth straight quarterly revenue beat. Whether that survives the next NAND price cycle is the open question. The risk is capacity: Sandisk is lifting fiscal 2026 capital spending to accelerate its BiCS8 node, the current generation of its 3D NAND, and adding supply is the classic mechanism that ends memory up-cycles.
How the Valuation Compares
On a trailing basis, Sandisk looks expensive at about 73x earnings. On a forward basis, it does not, trading near 13x next-twelve-month earnings because estimates are climbing faster than the price.
Against peers, the read is mixed. Western Digital trades near 47x forward earnings and Samsung Electronics near 7x, leaving Sandisk’s 13x in between. On EV/EBITDA, a measure of total company value against cash earnings, Sandisk sits near 9x versus a peer median of around 18x. The discount to Western Digital looks justified only if Sandisk’s margins prove more durable than this industry’s history suggests.
The balance sheet is a clear strength. Sandisk now holds net cash of about $3.5 billion, a reversal for a company that began with $2 billion of debt at spinoff. Visoso confirmed the debt is gone and pointed to a $6 billion buyback as the next use of free cash flow.
 Sandisk NTM Price / (P/E) (TIKR)
See how Sandisk performs against its peers in TIKR (It’s free!) >>>
TIKR Advanced Model Analysis
In the mid-case scenario, the TIKR Valuation Model targets around $3,120, implying a total return of around 43% over four years, or about 9% annualized through mid-2030.
- Current Price: $2,182.45
- Target Price (Mid): ~$3,120
- Potential Total Return: ~43%
- Annualized IRR: ~9% / year
 Sandisk Advanced Valuation Model (TIKR)
See analysts’ growth forecasts and price targets for Sandisk stock (It’s free!) >>>
Two revenue drivers carry the case: data center and enterprise SSD demand, plus the supply agreements that lock in volume at protected pricing. The margin driver is that contract structure, which the model assumes holds net income margins around 62%. The primary risk is NAND price reversion. The upside: if demand stays ahead of supply and the contracts scale, the high case points to around $4,240. The downside: if pricing rolls over first, the low case sits near $2,260, barely above today’s price.
Conclusion
The first test is the June 22 swap close. If the stock absorbs Western Digital’s exit without a meaningful drawdown, the bear case that this was distribution at a top loses force. If it slides hard, the overhang was real and momentum was carrying more of the price than fundamentals.
The deeper test is the next earnings report, expected in August. Watch gross margin against management’s guided peak-cycle range. Margins holding near guidance would support the claim that the new business models have broken the cycle. Margins slipping would tell you the old memory math still applies, no matter how strong the AI story sounds today.
See what stocks billionaire investors are buying so you can follow the smart money with TIKR.
Should You Invest in Sandisk?
The only way to really know is to look at the numbers yourself. TIKR gives you free access to the same institutional-quality financial data that professional analysts use to answer exactly that question.
Pull up Sandisk, and you’ll see years of historical financials, what Wall Street analysts expect for revenue and earnings in the quarters ahead, how valuation multiples have moved over time, and whether price targets are trending up or down.
You can build a free watchlist to track Sandisk alongside every other stock on your radar. No credit card required. Just the data you need to decide for yourself.
Analyze Sandisk on TIKR Free →
Looking for New Opportunities?
- See what stocks billionaire investors are buying so you can follow the smart money.
- Analyze stocks in as little as 5 minutes with TIKR’s all-in-one, easy-to-use platform.
- The more rocks you overturn… the more opportunities you’ll uncover. Search 100K+ global stocks, global top investor holdings, and more with TIKR.
Disclaimer:
Please note that the articles on TIKR are not intended to serve as investment or financial advice from TIKR or our content team, nor are they recommendations to buy or sell any stocks. We create our content based on TIKR Terminal’s investment data and analysts’ estimates. Our analysis might not include recent company news or important updates. TIKR has no position in any stocks mentioned. Thank you for reading, and happy investing!


추천 콘텐츠

Israeli Airstrike on Tehran: A Critical Escalation in Regional Tensions

Ethereum koers toont zeldzaam dubbel koopsignaal en richt zich op $4.550

How Trump uses verbs to obscure reality —and dodge responsibility


인기 뉴스
더보기
