

Solana jumps 20% before stalling at key resistance as traders eye $78
Solana has rallied more than 20% from its June low before retreating from a major resistance zone, as easing geopolitical tensions and rising activity in tokenized equities boosted risk appetite while traders turned cautious ahead of the Federal Reserve’s latest policy decision.
- Solana rebounded over 20% from its June low of $62.44, reaching $75.60 before encountering resistance near the Supertrend level.
- Growing tokenized stock activity, corporate SOL accumulation, and easing Middle East tensions helped fuel the rally.
- Traders are watching resistance between $75 and $78, while Fed policy uncertainty and a bearish flag setup could threaten further upside.
According to data from crypto.news, Solana (SOL) climbed from a local low of $62.44 to a high of $75.60 before pulling back to around $72.50 at press time.
SOL’s rebound followed a relief rally across crypto markets after the U.S. administration announced a peace agreement with Iran and reopened the Strait of Hormuz, a development that helped push oil prices lower and encouraged investors to rotate back into risk assets.
At the same time, capital continued to flow into Solana’s growing real-world asset ecosystem. Tokenized stock activity accelerated after the launch of on-chain SpaceX equity products, helping Solana-native tokenized assets surpass key volume milestones and drawing fresh attention to the network as a settlement layer for traditional financial products.
Corporate treasury demand has also remained a tailwind. Recent disclosures showed several public companies adding to their SOL holdings, while takeover discussions among Solana-focused treasury firms kept attention on the asset’s long-term balance-sheet appeal. With roughly two-thirds of Solana’s circulating supply staked, large spot purchases continue to have an outsized effect on available liquidity.
Technical indicators place Solana at a critical decision point
The daily chart shows SOL recovering sharply from the June selloff but running directly into resistance near $75.20, which coincides with the Supertrend indicator. A decisive close above that level would represent the first meaningful break above trend resistance since May.
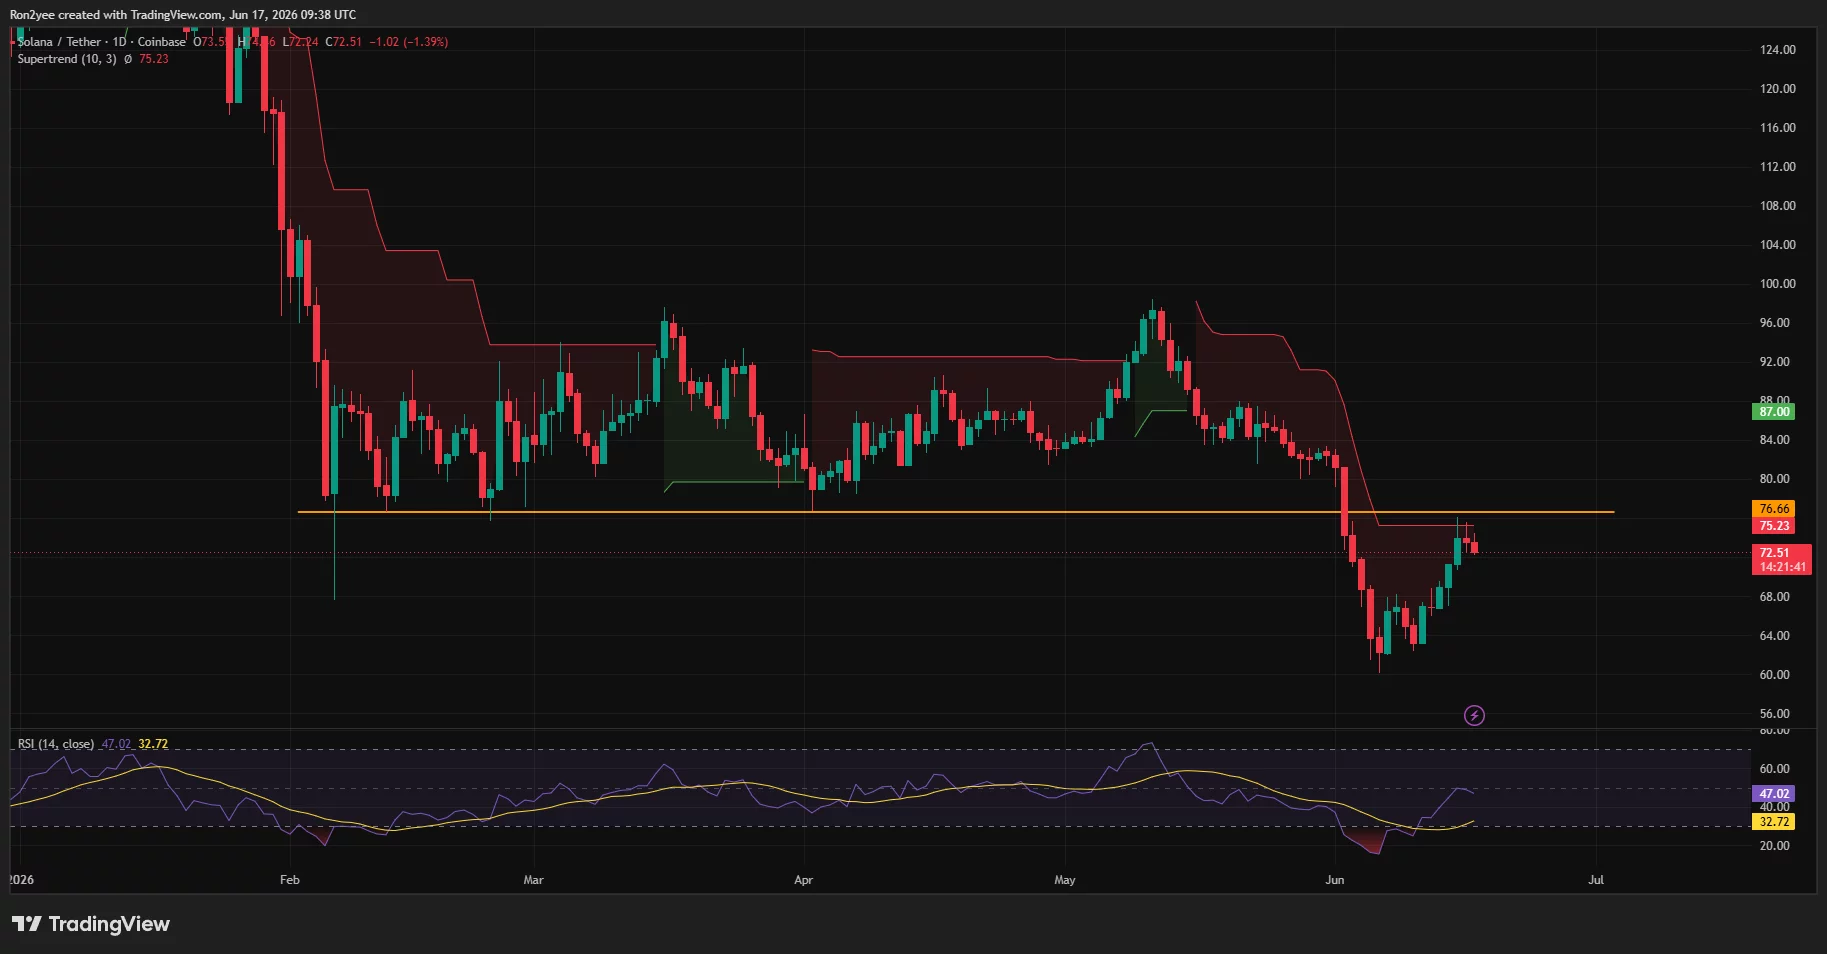
Momentum indicators remain mixed. Daily RSI has recovered to around 47 after reaching oversold territory near the recent bottom, suggesting selling pressure has eased but bullish momentum has not fully returned.
On the four-hour chart, price is consolidating around the 50% Fibonacci retracement level near $71.80 after briefly reclaiming the 38.2% retracement at $74.55.
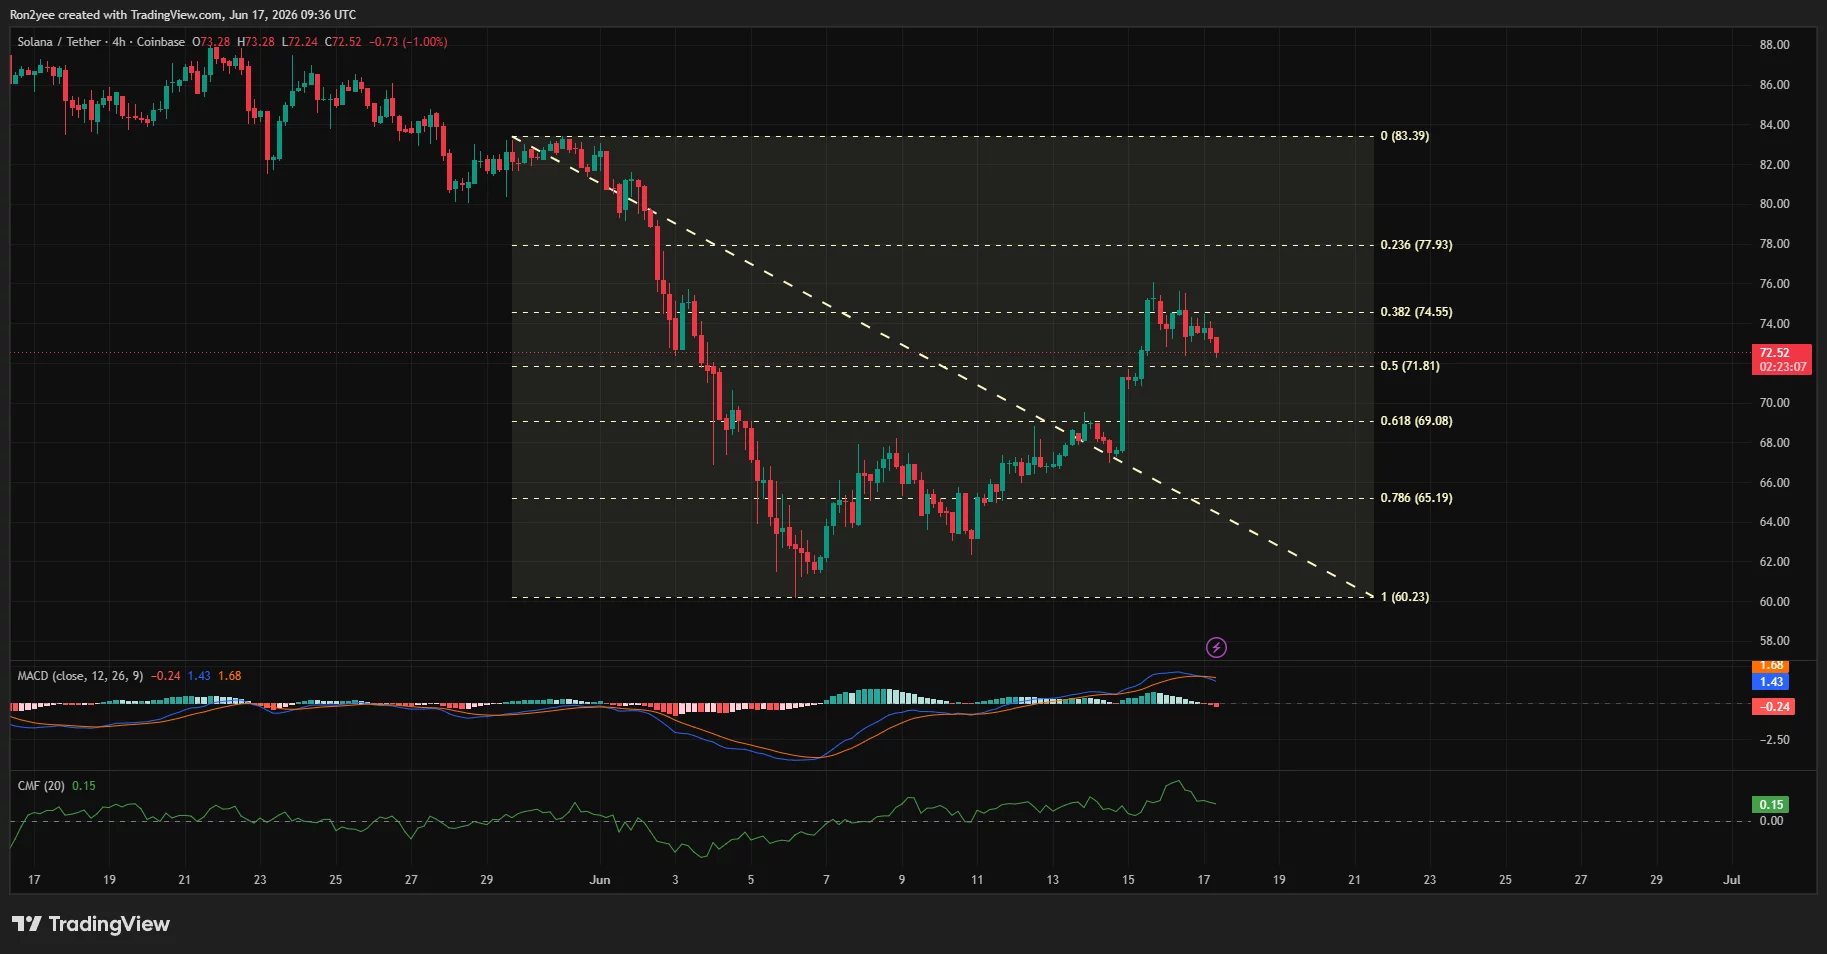
Additional upside targets sit near $77.90 and $83.40 if buyers regain control. Beneath the market, support levels are clustered around $71.80, $69.10, and $65.20, with a break below those areas threatening the recovery structure established over the past week.
Commenting on the recent move, analyst Daan Crypto Trades argued that SOL is attempting to break out of a falling wedge against Bitcoin.
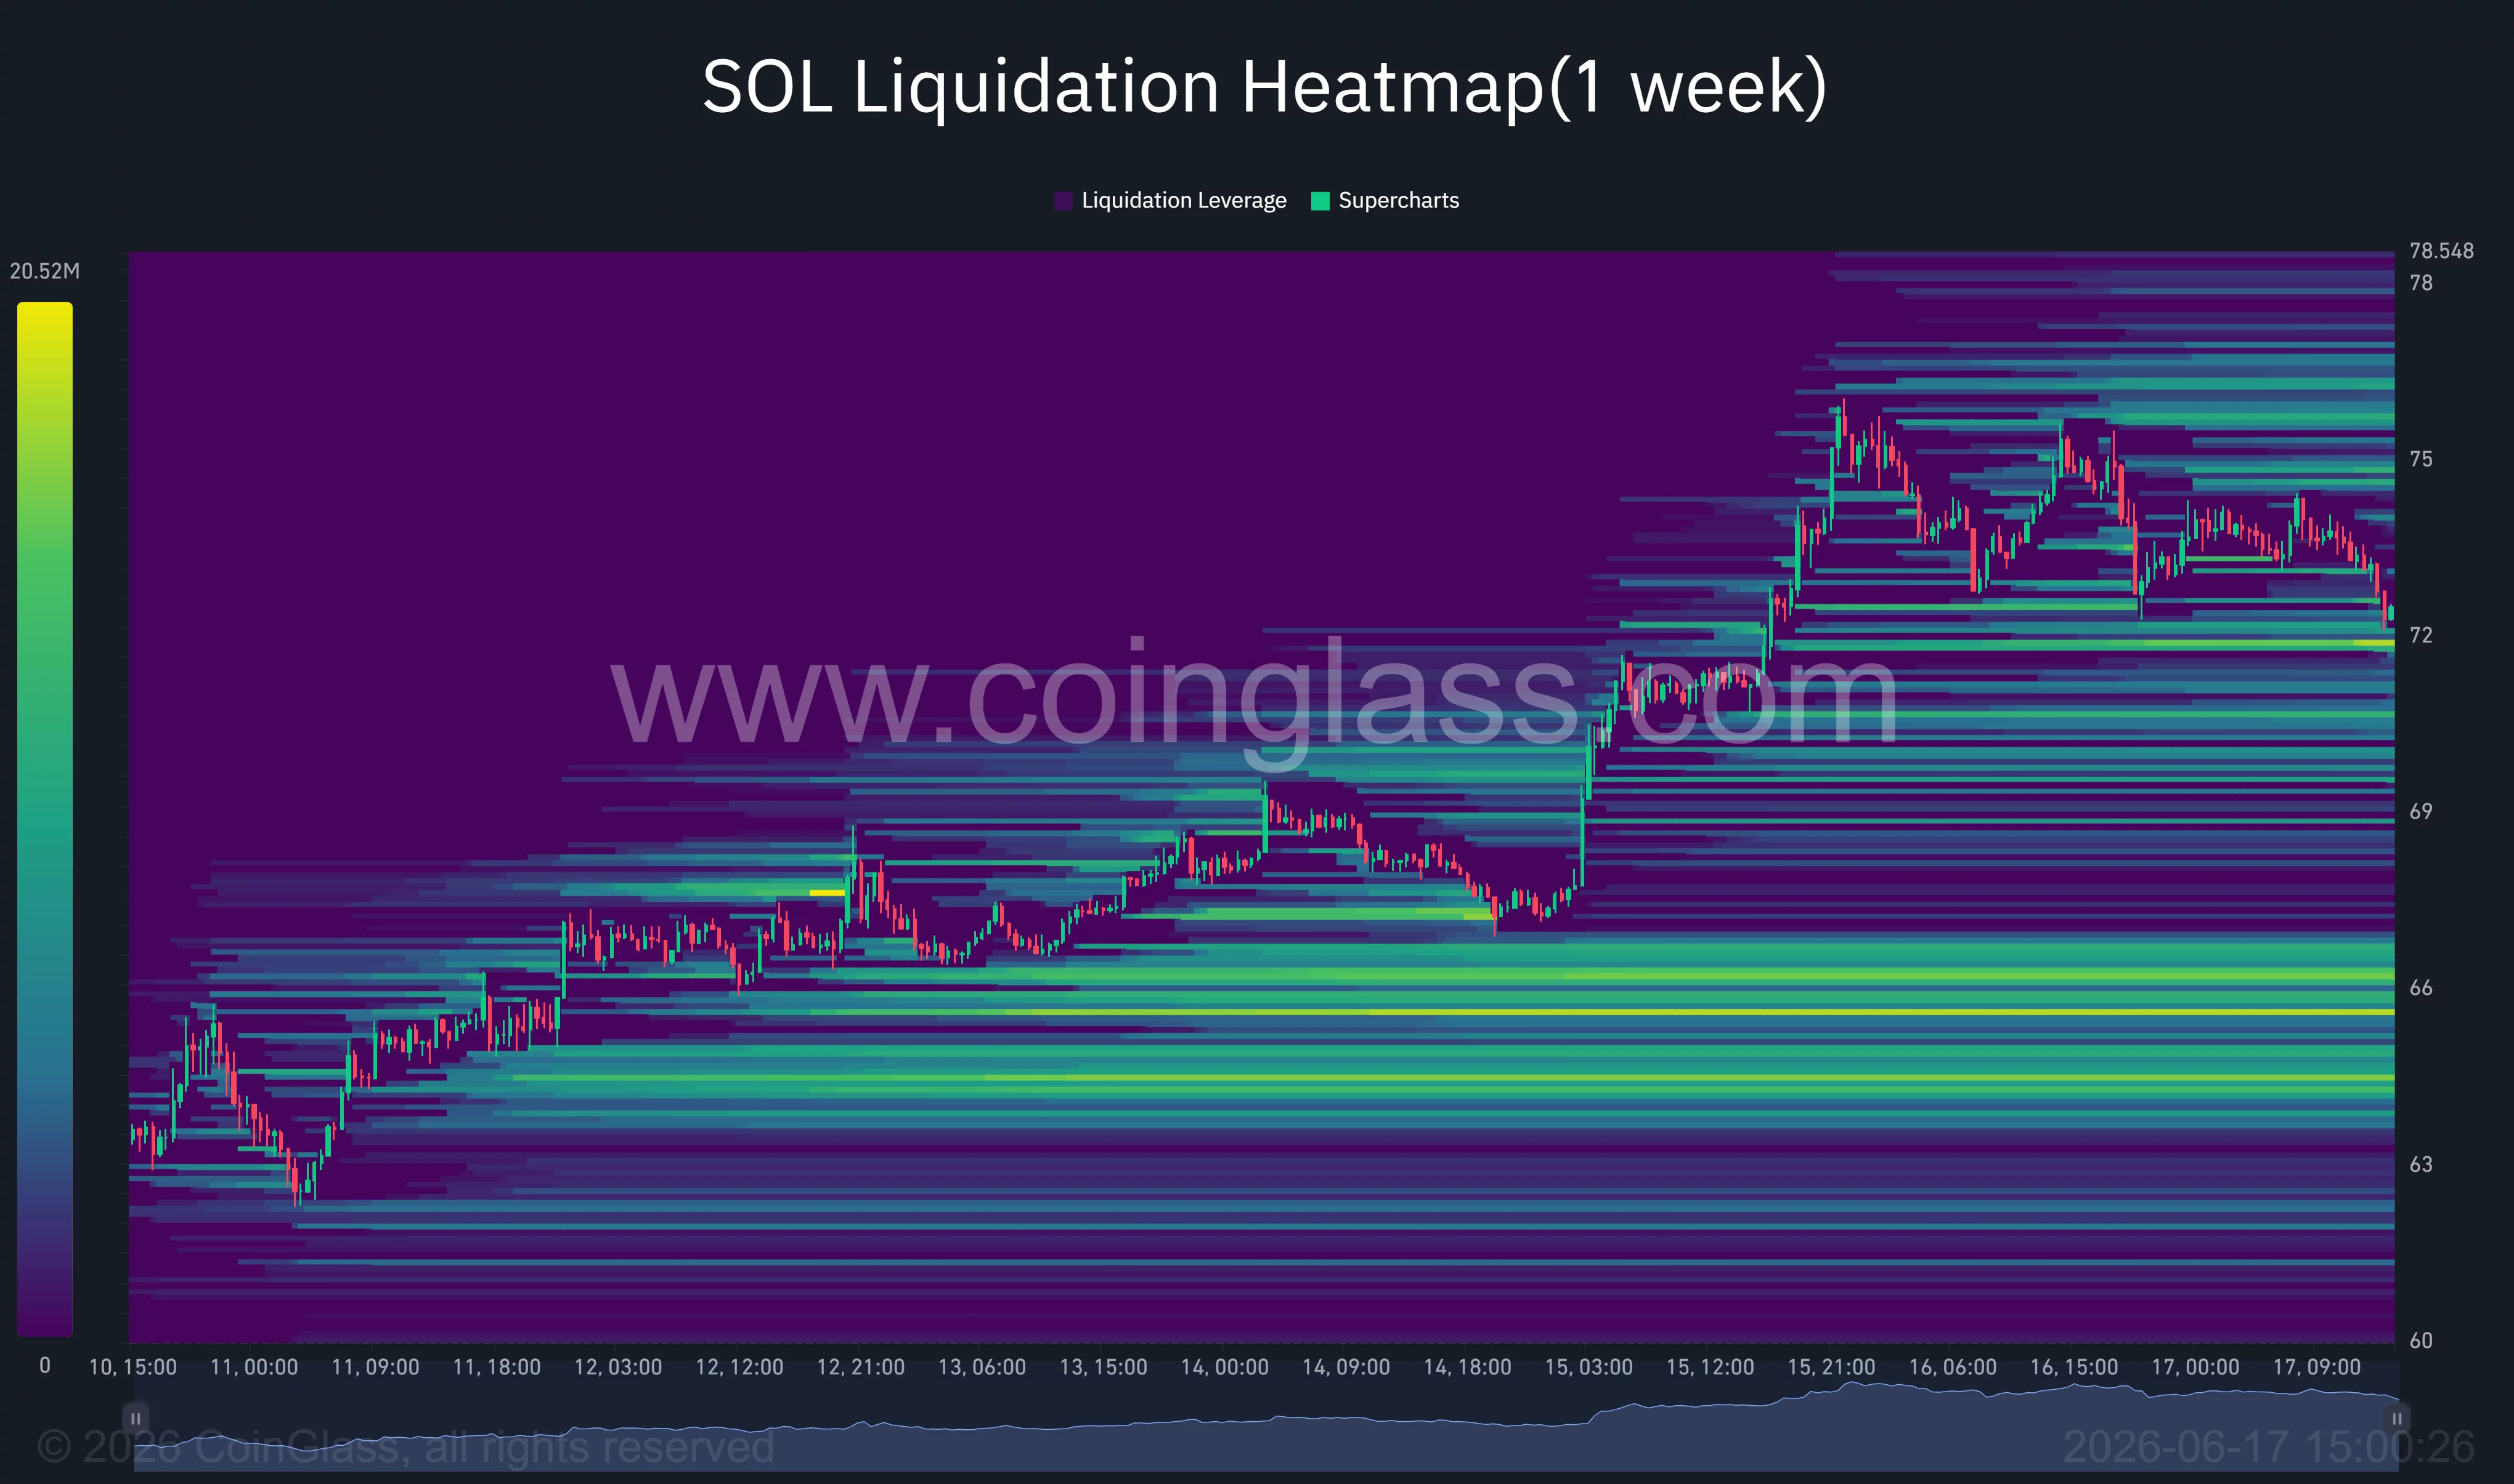
Derivatives data offers further evidence that traders are positioning for a larger move. CoinGlass liquidation heatmaps show sizeable leverage clusters concentrated near $78 on the upside, while another major liquidity pocket remains around $65-$66. Markets often gravitate toward these zones as leveraged positions accumulate.
The four-hour MACD remains above its signal line despite a decline in histogram strength, while Chaikin Money Flow holds near 0.15, showing capital continues entering the asset even after the recent pullback.
Fed uncertainty and resistance levels threaten the recovery
However, not all signals favor the bulls. Federal Reserve Chair Kevin Warsh’s first policy meeting has become the market’s primary macro focus, with traders closely watching updated rate projections and any indication that borrowing costs could stay elevated longer than expected.
Higher-than-expected inflation readings and renewed demand for defensive assets could pressure cryptocurrencies if risk sentiment deteriorates. A stronger U.S. dollar following the Fed decision would likely create another obstacle for speculative assets, including Solana.
Traders are also watching the $75-$78 region closely. Crypto analyst Crypto Coral recently highlighted that SOL had broken down from a bearish flag structure and was retesting resistance near its moving averages. Failure to reclaim that zone could encourage sellers to target support near $69 and potentially the $65 liquidity cluster identified in derivatives markets.
Disclosure: This article does not represent investment advice. The content and materials featured on this page are for educational purposes only.


추천 콘텐츠

When a hamstring pull is more than just a strain

How Deep Are The Newsoms In It?

UM climbs to highest-ever position of 56th in QS World University Rankings


인기 뉴스
더보기
