The World Cup kicked off this week, and the tournament’s prediction markets are settling on Chainlink. ADI Predictstreet, the first official prediction‑market partnerThe World Cup kicked off this week, and the tournament’s prediction markets are settling on Chainlink. ADI Predictstreet, the first official prediction‑market partner

Chainlink Powers World Cup Prediction Markets – LINK Price Down 26% Despite Record On‑Chain Activity

2026/06/13 03:00
5분 읽기
이 콘텐츠에 대한 의견이나 우려 사항이 있으시면 crypto.news@mexc.com으로 연락주시기 바랍니다

The World Cup kicked off this week, and the tournament’s prediction markets are settling on Chainlink. ADI Predictstreet, the first official prediction‑market partner of the event, runs exclusively on Chainlink oracles.

Myriad settles more than 75 tournament contracts the same way, and Polymarket’s World Cup winner market crossed approximately $1.6 billion before the opening match.

Despite these massive adoption news, LINK’s price has not noticed. The token trades near $7.90, close to 90‑day lows and down 26% from mid‑May, caught in the broad June risk‑off.

Let’s explain the data and why this disconnect matters.

Santiment’s Report: Adoption Without Hype

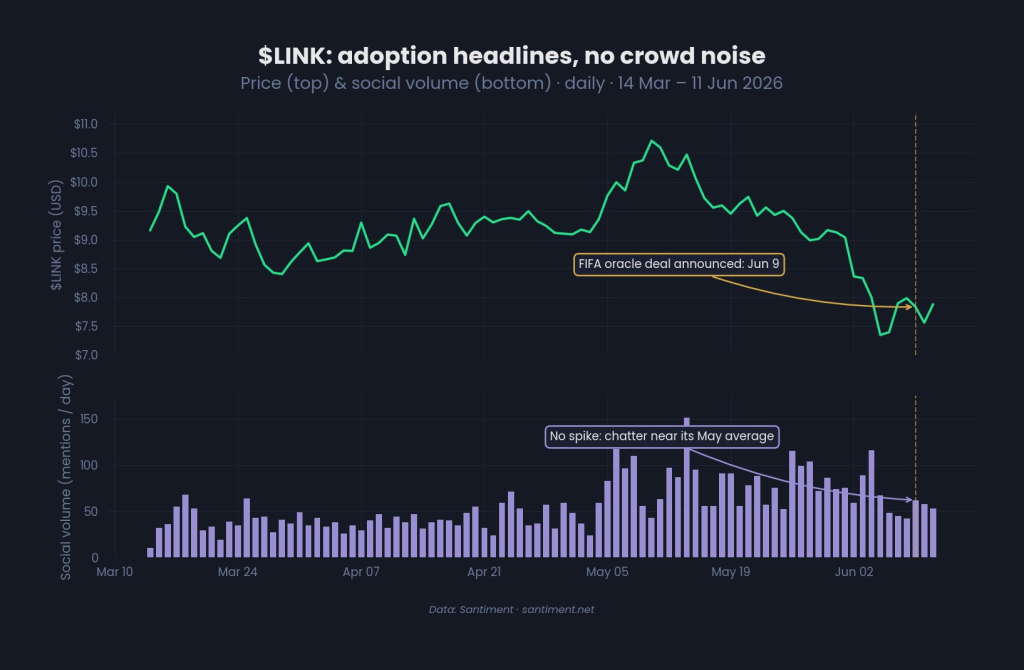
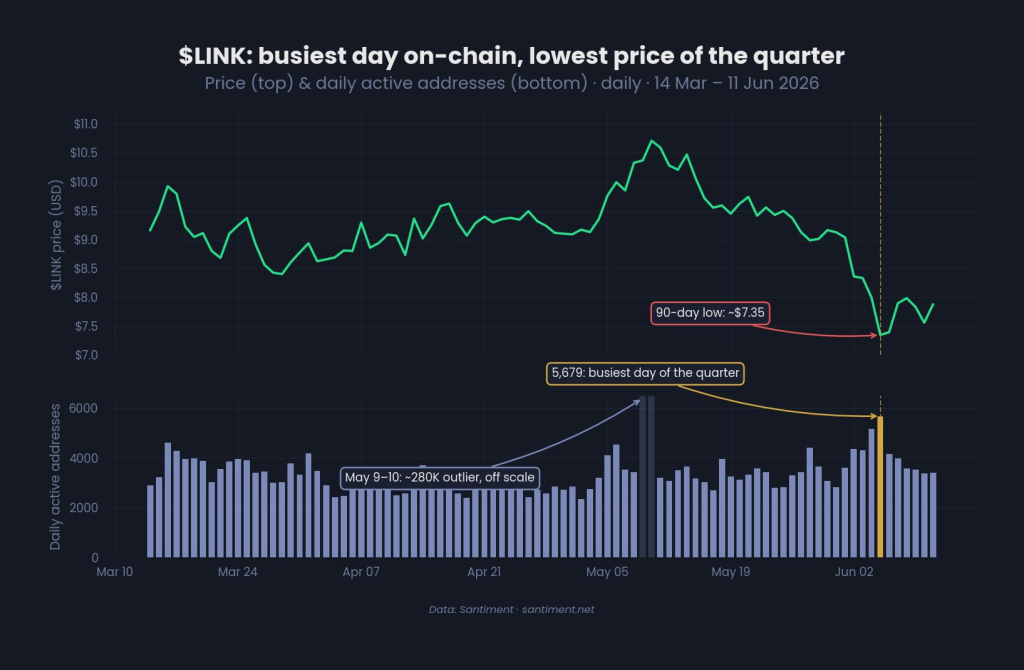
Santiment’s on‑chain and social data reveal a striking picture. Daily active addresses on Chainlink are averaging roughly 4,100 in June, up about 25% from the spring norm. The busiest day of the quarter was June 5, with 5,679 active addresses. That same day, LINK’s price printed its 90‑day low of approximately $7.35.

Two charts (attached) illustrate the disconnect. The first chart shows price and social volume. The FIFA oracle deal was announced on June 9. Despite that news, social volume did not spike – it remained near its May average. No crowd hype. The second chart shows price and daily active addresses. Address activity has been rising while price has been falling. The busiest on‑chain day coincided with the lowest price of the quarter.

Source: X/@SantimentData

Santiment notes that the adoption stack is not built on crowd hype. The tournament is running on Chainlink’s rails, but the token is trading on macro.

Source: X/@SantimentData

Why the Disconnect? Macro Headwinds Overwhelm Fundamentals

LINK’s price weakness is part of a broader June risk‑off across crypto and risk assets. Bitcoin price has fallen from $71,000 to $60,000. Gold and silver have dropped sharply. ETF outflows, Iran tensions, and high interest rates have drained liquidity. Reported government‑linked transfers of LINK have added an overhang of uncertainty, though the scale and intent remain unclear.

In this environment, even strong fundamental news – such as powering the World Cup prediction markets – is being ignored. Traders are focused on survival, not on long‑term adoption stories.

Read also: Chainlink (LINK) Price Faces Pressure, But Analysts Think a Rally Could Ahead

Why This Could Be Important for LINK Going Forward

The current disconnect between usage and price is not permanent. When the macro headwinds fade – a Fed pivot, a ceasefire in the Middle East, or the CLARITY Act passing – the market will return to fundamentals. At that point, the fact that Chainlink is the exclusive oracle provider for the World Cup prediction markets will be re‑evaluated.

Several factors stand out:

  • Sticky adoption: Prediction markets are not a one‑off gimmick. They drive consistent on‑chain activity. The World Cup is a month‑long event, and the tournament contracts settle in real time. That generates steady demand for Chainlink oracles.
  • Institutional validation: ADI Predictstreet being the “first official prediction‑market partner” of the World Cup is a regulatory and branding milestone. It signals that traditional sports and betting entities trust Chainlink’s infrastructure.
  • User growth without hype: Daily active addresses are up 25% without a social media frenzy. That indicates organic adoption from actual users, not speculation. When the crowd eventually takes notice, the upside could be swift.
  • Price at 90‑day lows: LINK is trading near levels that have historically been accumulation zones. The risk‑reward favors upside over a 12‑month horizon, assuming the macro environment stabilizes.

Our Opinion

We have seen this pattern before. Fundamentals improve, on‑chain metrics climb, but price lags because of macro fear. Then, when sentiment changes, the market catches up quickly. The World Cup will run for another three weeks. The longer the tournament continues, the more settlement data accumulates on Chainlink. By the time the final whistle blows, there will be a clear record of massive oracle usage.

The market is currently pricing LINK as if nothing has changed. That is a mistake. The token is down 26% from mid‑May, but the network is busier than ever. The crowd is silent. Social volume is flat. That is precisely the kind of environment where long‑term accumulation makes sense.

For traders, the immediate trend is still down. LINK could test $7.00 if Bitcoin breaks $58K. But for investors with a 6‑12 month horizon, the $7.50‑$8.00 range is a compelling entry point. The tournament runs on its rails. The token trades on macro. When the macro turns, the price will follow the adoption.

FAQs

What World Cup prediction markets use Chainlink❓

ADI Predictstreet (official tournament partner) runs exclusively on Chainlink oracles. Myriad settles 75+ tournament contracts, and Polymarket’s winner market crossed $1.6B before kickoff.

Why is LINK price down if adoption is growing❓

Broad June risk‑off (ETF outflows, Iran tensions, high yields) has overwhelmed fundamentals. Reported government‑linked transfers also add overhang.

Subscribe to our YouTube channel for daily crypto updates, market insights, and expert analysis.

The post Chainlink Powers World Cup Prediction Markets – LINK Price Down 26% Despite Record On‑Chain Activity appeared first on CaptainAltcoin.

시장 기회
ADI 로고
ADI 가격(ADI)
$4.0134
$4.0134$4.0134
+2.04%
USD
ADI (ADI) 실시간 가격 차트

World Cup Combo: Aim for 200x

World Cup Combo: Aim for 200xWorld Cup Combo: Aim for 200x

Combine up to 20 World Cup matches in one order

면책 조항: 본 사이트에 재게시된 글들은 공개 플랫폼에서 가져온 것으로 정보 제공 목적으로만 제공됩니다. 이는 반드시 MEXC의 견해를 반영하는 것은 아닙니다. 모든 권리는 원저자에게 있습니다. 제3자의 권리를 침해하는 콘텐츠가 있다고 판단될 경우, crypto.news@mexc.com으로 연락하여 삭제 요청을 해주시기 바랍니다. MEXC는 콘텐츠의 정확성, 완전성 또는 시의적절성에 대해 어떠한 보증도 하지 않으며, 제공된 정보에 기반하여 취해진 어떠한 조치에 대해서도 책임을 지지 않습니다. 본 콘텐츠는 금융, 법률 또는 기타 전문적인 조언을 구성하지 않으며, MEXC의 추천이나 보증으로 간주되어서는 안 됩니다.

추천 콘텐츠

Israeli Airstrike on Tehran: A Critical Escalation in Regional Tensions

Israeli Airstrike on Tehran: A Critical Escalation in Regional Tensions

BitcoinWorld Israeli Airstrike on Tehran: A Critical Escalation in Regional Tensions The Israeli military confirmed a significant new airstrike targeting Tehran
공유하기
bitcoinworld2026/04/04 18:50
Ethereum koers toont zeldzaam dubbel koopsignaal en richt zich op $4.550

Ethereum koers toont zeldzaam dubbel koopsignaal en richt zich op $4.550

Connect met Like-minded Crypto Enthusiasts! Connect op Discord! Check onze Discord   Ethereum laat op de uurgrafiek twee opeenvolgende TD Sequential koopsignalen zien. Deze indicator meet uitputting in een trend en geeft vaak een signaal dat de verkoopdruk kan afnemen. Dit dubbele signaal verschijnt rond het niveau van $4.516, waar de ETH prijs kortstondig steun vindt. Dit type formatie komt zelden voor en wordt daarom extra nauwlettend gevolgd. Wat gaat de Ethereum koers hiermee doen? Ethereum koers test steun rond $4.516 De scherpe daling van de Ethereum koers vanaf de prijszone rond $4.800 bracht de ETH prijs in korte tijd naar ongeveer $4.516. Op dit niveau trad duidelijke koopactiviteit op, waardoor de neerwaartse beweging tijdelijk werd gestopt. Het dubbele signaal dat door de TD Sequential indicator is gegenereerd, viel precies samen met dit prijspunt. De TD Sequential is opgebouwd uit negen candles die een trend meetellen. Wanneer de negende candle verschijnt, kan dit duiden op een trendomslag. In dit geval verschenen zelfs twee signalen kort na elkaar, wat aangeeft dat de verkoopdruk mogelijk uitgeput is. Het feit dat dit gebeurde in een zone waar ETH kopers actief bleven, maakt het patroon extra opvallend. TD Sequential just flashed two buy signals for Ethereum $ETH! pic.twitter.com/JPO8EhiEPi — Ali (@ali_charts) September 16, 2025 Welke crypto nu kopen?Lees onze uitgebreide gids en leer welke crypto nu kopen verstandig kan zijn! Welke crypto nu kopen? Fed-voorzitter Jerome Powell heeft aangekondigd dat de rentes binnenkort zomaar eens omlaag zouden kunnen gaan, en tegelijkertijd blijft BlackRock volop crypto kopen, en dus lijkt de markt klaar om te gaan stijgen. Eén vraag komt telkens terug: welke crypto moet je nu kopen? In dit artikel bespreken we de munten die… Continue reading Ethereum koers toont zeldzaam dubbel koopsignaal en richt zich op $4.550 document.addEventListener('DOMContentLoaded', function() { var screenWidth = window.innerWidth; var excerpts = document.querySelectorAll('.lees-ook-description'); excerpts.forEach(function(description) { var excerpt = description.getAttribute('data-description'); var wordLimit = screenWidth wordLimit) { var trimmedDescription = excerpt.split(' ').slice(0, wordLimit).join(' ') + '...'; description.textContent = trimmedDescription; } }); }); Technische indicatoren schetsen herstelkans voor ETH Naast de dubbele koopsignalen verstrekken ook andere indicatoren belangrijke aanwijzingen. Tijdens de daling van de ETH koers waren grote rode candles zichtbaar, maar na de test van $4.516 stabiliseerde de Ethereum koers. Dit wijst op een mogelijke verschuiving in het evenwicht tussen de bears en bulls. Als deze opwaartse beweging doorzet, liggen de eerste weerstanden rond $4.550. Daarboven wacht een sterkere zone rond $4.650. Deze niveaus zijn in eerdere Ethereum sessies al meerdere keren getest. Een doorbraak zou ruimte openen richting de all-time high van ETH rond $4.953. Wanneer de prijs toch opnieuw onder $4.516 zakt, liggen er zones rond $4.500 en $4.450 waar grotere kooporders worden verwacht. Deze niveaus kunnen als een vangnet fungeren, mocht de druk opnieuw toenemen. Marktdynamiek bevestigt technische indicatoren De huidige situatie volgt op een bredere correctie in de cryptomarkt. Verschillende vooraanstaande crypto tokens zagen scherpe koersdalingen, waarna traders op zoek gingen naar signalen voor een mogelijke ommekeer. Dat juist Ethereum nu een dubbel TD Sequential signaal toont, versterkt de interesse in dit scenario. Fundamenteel blijft Ethereum sterk. Het aantal ETH tokens dat via staking is vastgezet, blijft groeien. Dat verkleint de vrije circulatie en vermindert verkoopdruk. Tegelijk blijft het netwerk intensief gebruikt voor DeFi, NFT’s en stablecoins. Deze activiteiten zorgen voor een stabiele vraag naar ETH, ook wanneer de prijs tijdelijk onder druk staat. Fundamentele drijfveren achter de Ethereum koers De Ethereum koers wordt echter niet alleen bepaald door candles en patronen, maar ook door bredere factoren. Een stijgend percentage van de totale ETH supply staat vast in staking contracten. Hierdoor neemt de liquiditeit op exchanges af. Dit kan prijsschommelingen versterken wanneer er plotseling meer koopdruk ontstaat. Daarnaast is Ethereum nog steeds het grootste smart contract platform. Nieuwe standaarden zoals ERC-8004 en ontwikkelingen rond layer-2 oplossingen houden de activiteit hoog. Deze technologische vooruitgang kan de waardepropositie ondersteunen en zo indirect bijdragen aan een ETH prijsherstel. Het belang van de korte termijn dynamiek De komende handelsdagen zullen duidelijk maken of de bulls genoeg kracht hebben om door de weerstandszone rond $4.550 te breken. Voor de bears ligt de focus juist op het verdedigen van de prijsregio rond $4.516. De whales, die met grote handelsorders opereren, kunnen hierin een beslissende rol spelen. Het dubbele TD Sequential signaal blijft hoe dan ook een zeldzame gebeurtenis. Voor cryptoanalisten vormt het een objectief aanknopingspunt om de kracht van de huidige Ethereum trend te toetsen. Vooruitblik op de ETH koers Ethereum liet twee opeenvolgende TD Sequential signalen zien op de uurgrafiek, iets wat zelden voorkomt. Deze formatie viel samen met steun rond $4.516, waar de bulls actief werden. Als de Ethereum koers boven dit niveau blijft, kan er ruimte ontstaan richting $4.550 en mogelijk $4.650. Zakt de prijs toch opnieuw onder $4.516, dan komen $4.500 en $4.450 in beeld als nieuwe steunzones. De combinatie van zeldzame indicatoren en een sterke fundamentele basis maakt Ethereum interessant voor zowel technische als fundamentele analyses. Of de bulls het momentum echt kunnen overnemen, zal blijken zodra de Ethereum koers de eerstvolgende weerstanden opnieuw test. Koop je crypto via Best Wallet Best wallet is een topklasse crypto wallet waarmee je anoniem crypto kan kopen. Met meer dan 60 chains gesupport kan je al je main crypto coins aanschaffen via Best Wallet. Best wallet - betrouwbare en anonieme wallet Best wallet - betrouwbare en anonieme wallet Meer dan 60 chains beschikbaar voor alle crypto Vroege toegang tot nieuwe projecten Hoge staking belongingen Lage transactiekosten Best wallet review Koop nu via Best Wallet Let op: cryptocurrency is een zeer volatiele en ongereguleerde investering. Doe je eigen onderzoek. Het bericht Ethereum koers toont zeldzaam dubbel koopsignaal en richt zich op $4.550 is geschreven door Dirk van Haaster en verscheen als eerst op Bitcoinmagazine.nl.
공유하기
Coinstats2025/09/17 23:31
How Trump uses verbs to obscure reality —and dodge responsibility

How Trump uses verbs to obscure reality —and dodge responsibility

President Donald Trump is known for his singular way of speaking. It tends to be, to quote Shakespeare, “full of sound and fury.” But according to a language expert
공유하기
Alternet2026/04/04 05:18

Score Your Share of 50K USDT

Score Your Share of 50K USDTScore Your Share of 50K USDT

Complete DEX+ tasks to unlock the Champion Wheel