

If you trade regularly on MEXC, you've probably come across oil-related derivatives at some point. But for most crypto traders, oil remains a fairly unfamiliar market, because the forces driving its pIf you trade regularly on MEXC, you've probably come across oil-related derivatives at some point. But for most crypto traders, oil remains a fairly unfamiliar market, because the forces driving its p

If you trade regularly on MEXC, you've probably come across oil-related derivatives at some point. But for most crypto traders, oil remains a fairly unfamiliar market, because the forces driving its price action are very different from what moves Bitcoin or altcoins.
Beyond the usual fundamental analysis and technical indicators, oil prices are heavily shaped by global supply and demand, production output, inventory levels, OPEC+ decisions, the strength of the U.S. dollar, and especially geopolitical shocks.
A single surprise inventory report, a production cut announcement, or rising tension in a major producing region can send oil prices swinging hard.
This article breaks down the most important factors actually driving oil price moves, so crypto traders can approach this market with more confidence.
Key Takeaways
- Oil prices are heavily influenced by supply and demand, OPEC+, inventories, and geopolitics.
- The Fed and the U.S. dollar can shift oil's broader trend.
- Speculative flows in futures markets can amplify price swings.
- Crypto traders shouldn't rely purely on crypto-market intuition when trading oil.
1. The Current Market Backdrop
According to MEXC data, oil derivatives are currently trading in the $90-$100 range, up roughly 14% since late August. The core driver behind this September 2026 surge isn't a boom in consumption. In fact, the IEA is forecasting that global oil demand will decline in 2026, not rise. The real story is entirely on the supply side, specifically, three chokepoints breaking down at once.
The first is the Strait of Hormuz, the strategic shipping lane through which roughly one-fifth of global oil output must pass. Military conflict involving Iran has caused a sharp drop in tanker traffic through the strait, with preliminary vessel-tracking data showing shipping volumes at roughly a quarter of the average seen just ten days earlier.
The second, and arguably the freshest shock sending oil prices "jumping", is a series of attacks on Saudi Arabia's export infrastructure. Crude loading operations at the strategic Yanbu export terminal on the Red Sea have been suspended, forcing Riyadh to cancel several shipments to European buyers. Yanbu is a critical bypass route that lets Saudi crude avoid Hormuz altogether, and with both routes disrupted simultaneously, the market has started calling this a "double chokepoint" risk.
The third is what might be called the OPEC+ paradox: the group keeps announcing higher production quotas on paper, yet actual output keeps falling, because the key exporting nations (Saudi Arabia, Iran, Russia, Kazakhstan) are seeing their exports disrupted by conflict, not by any deliberate policy choice to cut back. When supply drops due to force majeure rather than policy decisions, the market loses its ability to forecast ahead, and a geopolitical risk premium gets baked directly into the price, with some estimates putting that premium as high as $8-$12 per barrel.
The result has been a sharp global inventory drawdown. The IEA recorded observable stockpiles falling by more than 500 million barrels in just six months, and the futures curve has slipped into deep backwardation, meaning spot prices are trading well above future-dated contracts, a classic signal that the market is thirsty for oil right now, not worried about oil later.
2. Why Should Crypto Traders Care About What Drives Oil Prices?
To trade any asset well, you need to understand not just where the price is going, but why it's moving. This is exactly where many crypto traders fall short when they step into oil or traditional forex products. Coming from crypto, most traders default to reading charts for long/short entries while paying little attention to the fundamentals underneath the market.
That approach can work some of the time, but it's not enough for oil. Oil prices are driven heavily by real-world supply and demand, OPEC+ output, inventories, monetary policy, the dollar, and above all, geopolitics. A strong breakout candle sometimes has nothing to do with technical structure at all, it's the market repricing its supply-demand expectations in real time.
More importantly, oil isn't an isolated asset. It functions as a macro variable that can shift risk appetite across the entire financial market, crypto included. That's exactly why a crypto trader who never touches oil directly should still be watching this market closely.
Understanding what drives oil prices doesn't mean abandoning technical analysis, quite the opposite. Fundamentals explain why the market is moving, while technicals help you pinpoint when and where to actually enter a trade. Combine the two, and reading oil's price action becomes far more intuitive than simply staring at candles on a chart.
3. What Actually Moves Oil Prices?
Oil prices aren't set by a single factor, they're the product of interaction between multiple variables: supply and demand, geopolitics, monetary policy, inventories, and speculative capital flows. Some of these can move the price within minutes.
3.1. Oil Supply
In the short term, supply is usually the single most powerful driver of oil prices.
Events like war, sanctions, pipeline outages, or disruptions along strategic shipping routes like the Strait of Hormuz can wipe millions of barrels a day off the market almost instantly.
OPEC+ also plays an outsized role through its production increase or cut decisions. Traders should note that an announced quota doesn't always translate into the actual volume of oil hitting the market.
3.2. Global Oil Demand
On the flip side, oil prices are also heavily shaped by energy consumption demand.
When the economy is growing and manufacturing and transportation are expanding, oil demand typically rises alongside it. Conversely, an economic slowdown or prices that climb too high can trigger demand destruction, forcing businesses and consumers to cut back on energy use.
3.3. Geopolitics
Oil is one of the most geopolitically sensitive commodities in the world.
Conflict in the Middle East, Russia, or along key shipping lanes can generate a geopolitical risk premium, an added price bump reflecting the market's fear that future supply could be disrupted.
This is why oil prices can spike sharply even when the actual physical supply on the market hasn't dropped yet.
3.4. The Fed and the U.S. Dollar
Since oil is primarily priced in USD, moves by the Fed and the dollar carry real weight.
Typically, a stronger dollar puts downward pressure on commodity prices. But during periods of major supply shocks, that correlation can weaken, since the market becomes far more focused on the risk of an actual oil shortage.
3.5. Inventories and Strategic Reserves
Traders should also keep an eye on commercial oil inventories and strategic reserves.
If inventories keep falling, it signals that supply may not be keeping pace with demand. When reserves run low, the market also becomes far more sensitive to any headline about a potential supply disruption.
3.6. Speculative Capital Flows
Finally, there's positioning in the futures market.
Hedge funds, commodity ETFs, and large traders can open or close positions at massive scale, which amplifies oil's price swings well beyond what fundamentals alone would justify.
That means a sharp rally or selloff in oil often isn't purely fundamental, it's also driven by positioning, market psychology, and cascading liquidations.
For crypto traders, this should feel familiar, it has a lot in common with long squeezes and short squeezes on perpetual futures markets.
4. Three Scenarios for Oil Ahead, and What to Watch
Based on everything above, the market is currently pricing in three plausible scenarios for the rest of 2026.
Base case (highest probability): Middle East shipping routes continue operating under a "living with tension" state, supply recovers very slowly, and inventories stay low. Brent trades in the $90-$108 per barrel range through year-end, before gradually cooling off in 2027 if oil flows normalize.
Bullish scenario: If the conflict widens further, Hormuz or the Red Sea route remains blocked, or Saudi oil infrastructure is hit again, prices could spike into the $110-$130 per barrel range, a level not seen in years.
Bearish scenario: If a diplomatic resolution is reached and shipping routes normalize quickly, while China and U.S. economic weakness comes in worse than expected and drags demand down sharply, prices could fall back to the $75-$85 range within just a few weeks.
The most important indicators to watch if you want to "read" this market include: tanker traffic through Hormuz and the Red Sea, actual OPEC+ output compliance versus announced quotas, global commercial inventory levels, the backwardation/contango structure of futures contracts, and of course, Fed policy meetings, since a stronger or weaker dollar feeds back into every USD-denominated asset out there, from oil all the way to Bitcoin.
5. Trade Oil Directly on MEXC, Without Leaving the Crypto Ecosystem
If you're new to oil trading or simply curious about this market, MEXC makes it easy to get exposure without switching platforms. MEXC has rolled out USOIL (tracking WTI) and UKOIL (tracking Brent) perpetual contracts right within its TradFi Futures section, alongside gold, silver, and the S&P 500 index, all margined in USDT using the same funding rate and leverage mechanics crypto traders already know well.
The geopolitical tension earlier in 2026 drove a wave of capital into energy and precious metals contracts on MEXC, pushing trading volume in this category up sharply month over month, while the exchange's gold order book depth ranked among the deepest in the industry, a real advantage for reducing slippage during periods of heavy volatility like right now.
Put simply: instead of just guessing how a headline like "oil surges on Middle East tensions" might ripple into BTC, you can now go long or short on that exact variable directly, right inside an interface you already know.
Conclusion
Oil is one of the hardest markets to trade well, because its price is shaped simultaneously by supply and demand, geopolitics, monetary policy, inventories, and speculative capital flows. A single new headline about war, OPEC+, or supply disruptions can flip the market's direction fast.
For crypto traders, the key takeaway is not to rely purely on instincts built for crypto and apply them blindly to oil. This matters even more when trading leveraged products like USOIL or UKOIL, where position sizing and stop-losses need to come first. Big moves can create real opportunities, but they can also wipe out positions fast if risk isn't properly managed.
Understand the market first, find your entry second, that's probably the single most important rule when moving from crypto into oil.
Disclaimer: This content does not constitute investment, tax, legal, financial, or accounting advice. MEXC Blog provides this information for educational purposes only. Always do your own research, understand the risks, and invest responsibly.
市場の機会
Polytrade価格(TRADE)
--
----
USD
Polytrade (TRADE) ライブ価格チャート
このページで共有されている記事は公開プラットフォームから収集したものであり、参考情報としてのみ提供されています。MEXCの立場や見解を代表するものではありません。すべての権利は Van Dat Phan に帰属します。第三者の権利を侵害するコンテンツがあると思われる場合は、service@support.mexc.com までご連絡いただければ速やかに削除いたします。MEXCはいかなるコンテンツの正確性、完全性、適時性も保証せず、提供された情報に基づいて取られたいかなる行動についても責任を負いません。本コンテンツは、金融、法律、またはその他の専門的なアドバイスを構成するものではなく、MEXCによる推奨または支持として解釈されるべきものでもありません。専門家の洞察と詳細な分析については、MEXC 学ぶ をご覧ください。
Polytrade についてもっと知る
もっと見る
CPIが急上昇し、利上げ懸念が強まる中、米国債利回りが5%を突破、19年ぶりの高水準に:市場は何を織り込んでいるのか? | MEXC Alpha Trader 週間分析
2026年9月 第2週 報告期間:2026年9月9日~9月15日 データ基準日:2026年9月15日 市場概況 先週の暗号資産市場は、市場予想を上回るインフレデータ、利上げ観測の強まり、地政学的リスクの高まりという複数の下落要因が重なり、持続的な圧力を受けました。BTC は期間開始時点で$78,000付近からスタートしましたが、CPIが市場予想を上回り、米国債利回りが5%の節目を突破する中で下落基
2026/09/17

MEXC Alpha Trader Investment Research Weekly | "US Dollar Depreciation Trade" Ignites the Market, BTC and Gold Break Through Simultaneously—A New Paradigm or a Short-Term Frenzy?
2026年8月の第3週 統計期間:2026/8/19 – 2026/8/25 データ取得時点:2026/8/25 主要な動向 直近1週間、暗号資産市場では珍しく一斉な上昇が見られました。ビットコインは週初めに約$64,000でスタートし、$65,000、$70,000、$75,000、$80,000という4つの主要な整数ラインを次々と突破しました。8月25日のアジア市場時点では、BTCは$80,9
2026/08/27

OXYONとは?OndoによるOccidental Petroleum株式のトークン化を解説
Summary OXYON, styled by Ondo as OXYon, is a tokenized product designed to provide economic exposure linked to Occidental Petroleum Corporation (NYSE: OXY). The product chain is: Oil and Gas Markets ↓
2026/08/15
Polytrade の最新情報
もっと見る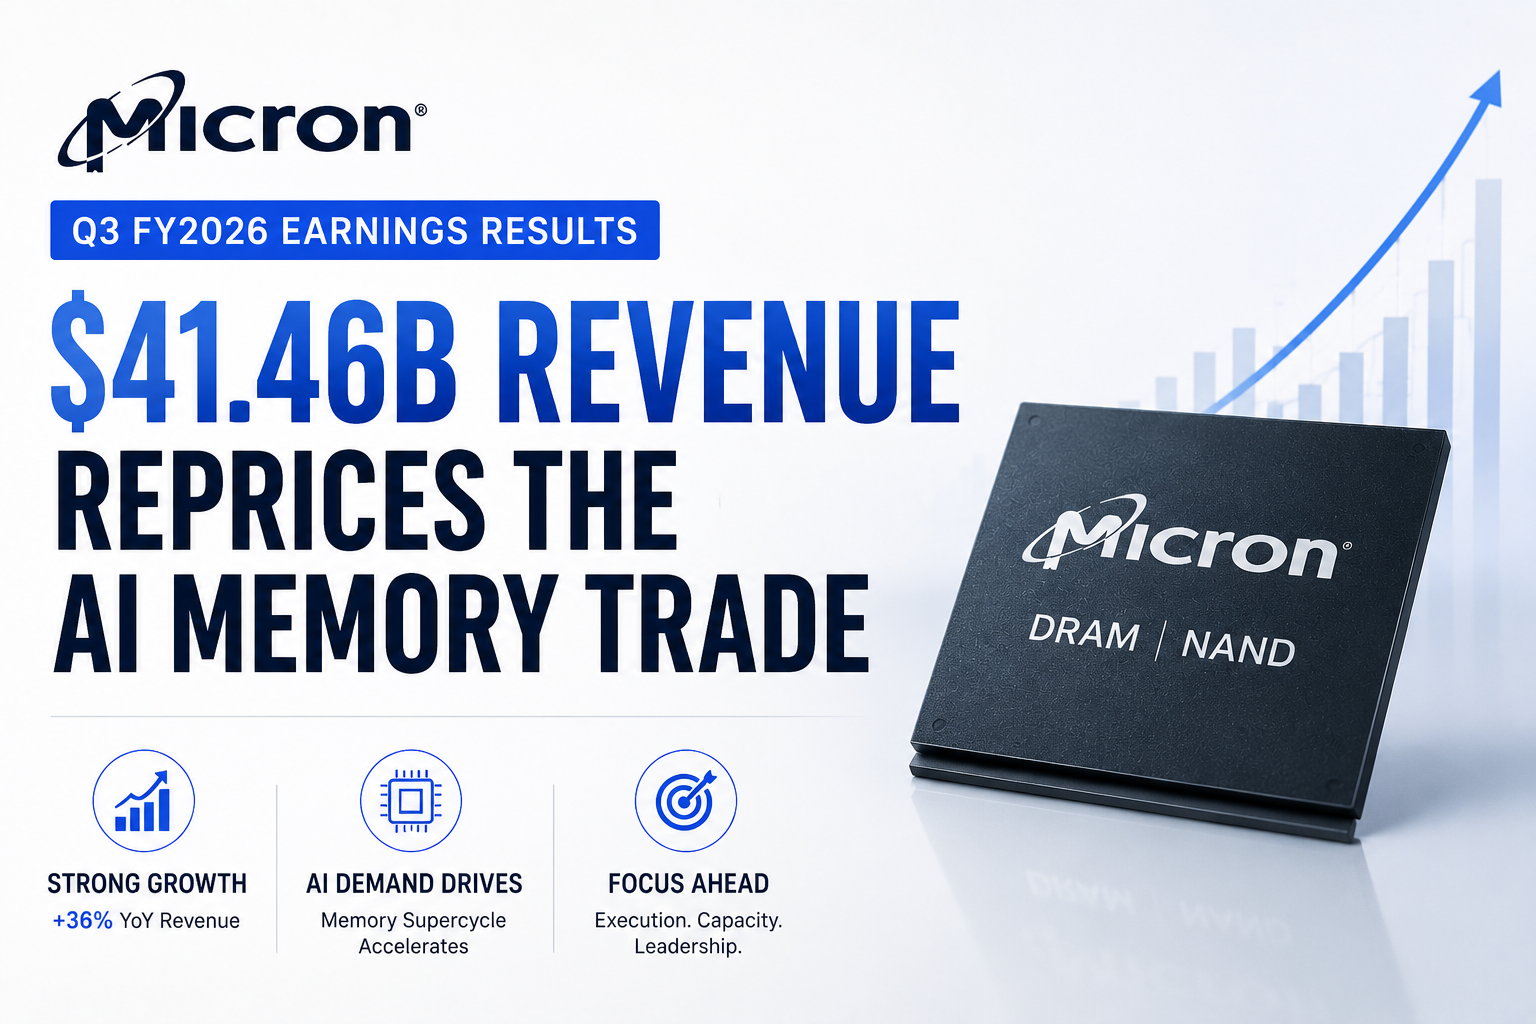
マイクロン2026年第3四半期決算:414億6000万ドルの収益がAIメモリ取引を再評価
マイクロン・テクノロジーは、AI関連のメモリやストレージの需要が供給を上回り続けたため、2026年第3四半期の収益が前年同期の93億ドルから414億6000万ドルへと大幅に増加し、記録的な決算を発表しました。非GAAPベースの希薄化後1株当たり利益(EPS)は25.11ドルに上昇し、非GAAPベースの売上高総利益率は84.9%に拡大しました。また、同社は第4四半期の収益を約500億ドル(±10億ドル)と予想しています。マイクロンはもはや周期的なDRAMおよびNANDのサプライヤーとしてのみ評価されているわけではないため、これは通常の決算ニュースではありません。マイクロンの最新の業績は、市場がAIインフラストラクチャの構築における戦略的ボトルネックとしてメモリを再評価していることを示唆しています。広帯域メモリ(HBM)、データセンター向けDRAM、エンタープライズSSD、および長期的な顧客供給契約は、AIサプライチェーンにおけるマイクロンの役割に対する投資家の考え方を再構築しています。
2026/06/25
NVIDIA 2026年年次株主総会:ジェンスン・フアンの「AIファクトリー」テーゼが直面する次の市場の試練
NVIDIAは太平洋時間2026年6月24日午前9時、2026年年次株主総会をオンラインで開催しました。正式な議題には、取締役の選任、役員報酬に関する勧告的承認、監査人の承認、およびいくつかの株主提案が含まれていました。しかし、市場にとって、この会議は単なる年次のガバナンス以上の意味を持っていました。それは、記録的な収益成長の年を経たNVIDIAが、AIインフラストラクチャにおける優位性を引き続き防御できるかどうかの新たなテストでした。
一部のアジア太平洋地域の投資家は現地時間6月25日にNVIDIAの年次総会をフォローしていましたが、公式の会議スケジュールは太平洋時間の6月24日でした。NVIDIAの2026年年次株主総会ページによると、このイベントはバーチャルで開催され、株主はオンラインで参加可能でした。
投資家にとっての重要な問題は、もはや単純にAIチップの需要が強いかどうかではありません。それはNVIDIAの2026年度の業績によってすでに証明されています。より大きな問題は、AIデータセンターへの支出が、より低いトークンコスト、より高い推論活動、および持続的な収益力に変換し続けられるかどうかです。言い換えれば、2026年の年次総会は単なる株主投票ではありませんでした。それはジェンスン・フアンの「AIファクトリー」テーゼの新たなチェックポイントだったのです。
2026/06/25

希少性トレードからバリュエーションの規律へ:SpaceXの反落がOpenAIのIPOの野心を試す
報道によると、OpenAIはIPOを2027年まで延期する方向に傾いていますが、より鋭い市場のシグナルはSpaceXから発せられています 。SpaceXは6月22日、154.60ドルと16.4%安で取引を終え、日中高値の225.64ドルから31.5%下落しましたが、135ドルのIPO価格は依然として14.5%上回っています 。この動きにより、SpaceXは純粋に希少性主導で成功したIPOから、AI関連のメガ上場サイクルにおける最初の主要な公開市場のストレステストへと変わりました 。OpenAIの課題は需要ではなく、価格にあります。ニューヨーク・タイムズ紙を引用したロイター通信の報道によると、OpenAIは最大1兆ドルという評価額目標を維持するために2027年まで待つことを検討しており、アドバイザーらはこの評価額を待つか、目標を下げて早期に上場するかの選択肢を提示しています 。予測市場はすでにその警戒感を反映しています。PolymarketのOpenAI IPO市場では最近、2026年12月31日までにOpenAIがIPOを行う確率は約4分の1であることが示されており、トレーダーがもはや短期的な上場を明確な基本シナリオ(ベースケース)とは見なしていないことを示唆しています 。暗号資産(仮想通貨)トレーダーにとって、これはAIのプレIPOエクスポージャーが一方通行の希少性トレードではなく、公開市場のベンチマークに結びついたバリュエーション規律トレードになりつつあることを意味します 。
2026/06/29


ホット
現在、市場で大きな注目を集めているトレンドの暗号資産
暗号資産価格
取引高が最も多い暗号資産