

Gold Price Prediction: Trapped Buyers at $4,500 – Most Traders Will Lose Here
Gold price didn’t have a great week. The price dipped 4% and now trades around $4,540, hovering just above the critical $4,500 support level. Analyst Itsadiee_Fx tweeted a detailed chart and analysis on May 17. He warns that most traders will lose at $4,500.
His reasoning is based on market psychology, liquidity hunting, and a trap setup on the daily timeframe. Let’s break down his tweet and chart, then give our honest opinion.
Itsadiee_Fx: Why Most Traders Will Lose at $4,500
Itsadiee_Fx starts with a simple observation. Just because gold reacted from the $4,500 low does not mean it is ready to continue a bullish move immediately. $4,500 is a very important key psychological support. No major rally usually starts by taking direct support from such a level without first creating liquidity.
He points out that gold previously formed a double bottom near $4,500, along with a W pattern structure. On May 6, the market gave a strong upside move after breaking the neckline of that W pattern. That neckline zone, around $4,640-$4,660, later acted as support during last week. Because of this, gold avoided continuing the bullish move directly. Instead, it moved downward to trap retail buyers who entered late at higher levels. The recent downside move was mainly to trap aggressive buyers and create liquidity.
Now, on the daily timeframe, a clear trap setup is visible. From the yearly high, gold has been forming a lower high structure. When price reached near $4,772, many traders became active sellers, expecting further downside. At the same time, the low near $4,500 did not create a proper lower low, but rather indicated a change of character (ChoCH) near a strong psychological level. This caused many buyers to step in. Now, to fully trap these buyers, the market has pushed price downward while playing a psychological game.
Based on recent price action, especially how gold behaved last Friday, he believes selling may continue in the short term. Gold price took support near $4,511 and closed bullish. Because of this, many traders likely entered buy positions with stop losses around $4,500 or slightly below. Since $4,500 is such a critical psychological level, the market will likely hunt these stop losses first. Until most of these buyers are forced out and their stops below $4,500 are triggered, a strong reversal is less likely.
His plan for Monday is simple. The market may trap buyers who entered from $4,500. It may create a scenario where $4,500 breaks, pushing traders to believe gold is strongly bearish. This will attract new sellers into the market. That is where the real move begins. If the market then reclaims and closes back above $4,500, the picture becomes clear: sellers will start getting trapped, their positions will act as liquidity for the upside, and the overall bias will shift fully bullish. The plan: wait for buyers to get trapped, watch sentiment flip bearish, then look for bullish continuation once the market reclaims $4,500.
Read also: Wall Street’s Gold and Silver Price Predictions for 2026
Chart Analysis: The 30-Minute and Daily Structure
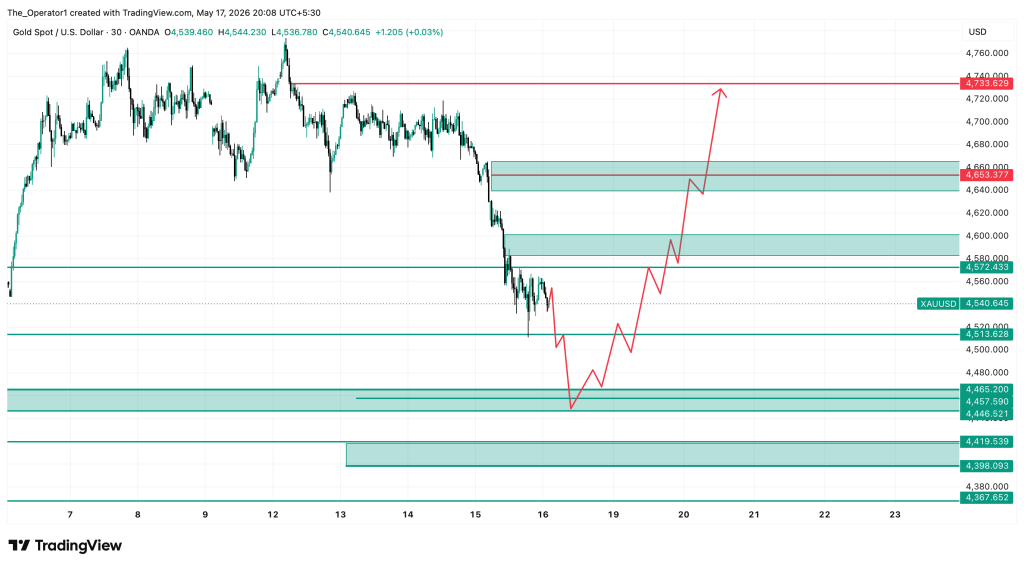
The attached chart (30-minute timeframe from TradingView) shows gold’s price action from early May to May 17. Key levels are annotated.
Price action highlights:
- Gold peaked near $4,760 in early May, then formed lower highs: $4,740, $4,720, $4,700, $4,680.
- A double bottom formed near $4,500 on May 6-7. The neckline was around $4,640-$4,660.
- Gold broke the neckline on May 6 and rallied to $4,740, then pulled back.
- The neckline zone (~$4,640-$4,660) acted as support but failed last week.
- Price then dropped to $4,511 (Friday low) and closed bullish, creating a wick.
 Source: X/@Itsadiee1
Key levels marked on chart:
Support: $4,500 (psychological), $4,465, $4,446, $4,419, $4,398, $4,380
Resistance: $4,520, $4,540, $4,572, $4,600, $4,620, $4,640, $4,653
Trap setup: The lower high structure from the yearly peak ($4,760) to recent highs ($4,740, $4,700) shows bearish momentum. The double bottom at $4,500 attracted buyers. Their stop losses are clustered below $4,500. The market is now pushing down to trigger those stops. Once stops are cleared, liquidity is available for a reversal.
Our Honest Opinion on Gold Price Prediction
Itsadiee_Fx’s analysis is textbook market psychology. The idea that key psychological levels act as stop-loss magnets is well known. The double bottom and W pattern are real technical formations. The lower high structure on the daily chart is also clear. His plan – wait for a break below $4,500, let sentiment turn bearish, then look for a reclaim as a buy signal – is logically sound.
That said, the setup has risks. First, gold is also driven by macro factors: dollar strength, real yields, central bank buying, and geopolitical risk. A sudden safe-haven bid could invalidate the trap and push price higher from $4,500 without a breakdown. Second, the trap might already be partially complete. The drop from $4,740 to $4,511 already shook out many weak longs. A small break below $4,500 might trigger only limited stops before a reversal.
Our view: the $4,500 level is critical. A daily close below $4,500 would likely accelerate selling toward $4,400-$4,350. That would confirm the bearish trap scenario. However, if gold holds $4,500 and bounces strongly this week, the trap fails and the bullish structure from the double bottom remains intact. Traders should watch Monday and Tuesday closely. A clean reclaim above $4,520-$4,540 would signal that the trap is over. Until then, downside risk for the gold price remains.
Subscribe to our YouTube channel for daily crypto updates, market insights, and expert analysis.
The post Gold Price Prediction: Trapped Buyers at $4,500 – Most Traders Will Lose Here appeared first on CaptainAltcoin.


You May Also Like

Crypto Hack: Drift Protocol Drained Over $200M in Private Key Breach

Bitcoin treasury sell-off accelerates as Riot, Bhutan, and public companies exit positions


