Ethereum price today: ETH grinds higher while long-term structure remains fragile


Traders face a nuanced setup as Ethereum price today grinds higher within a still-fragile long-term structure across multiple timeframes.
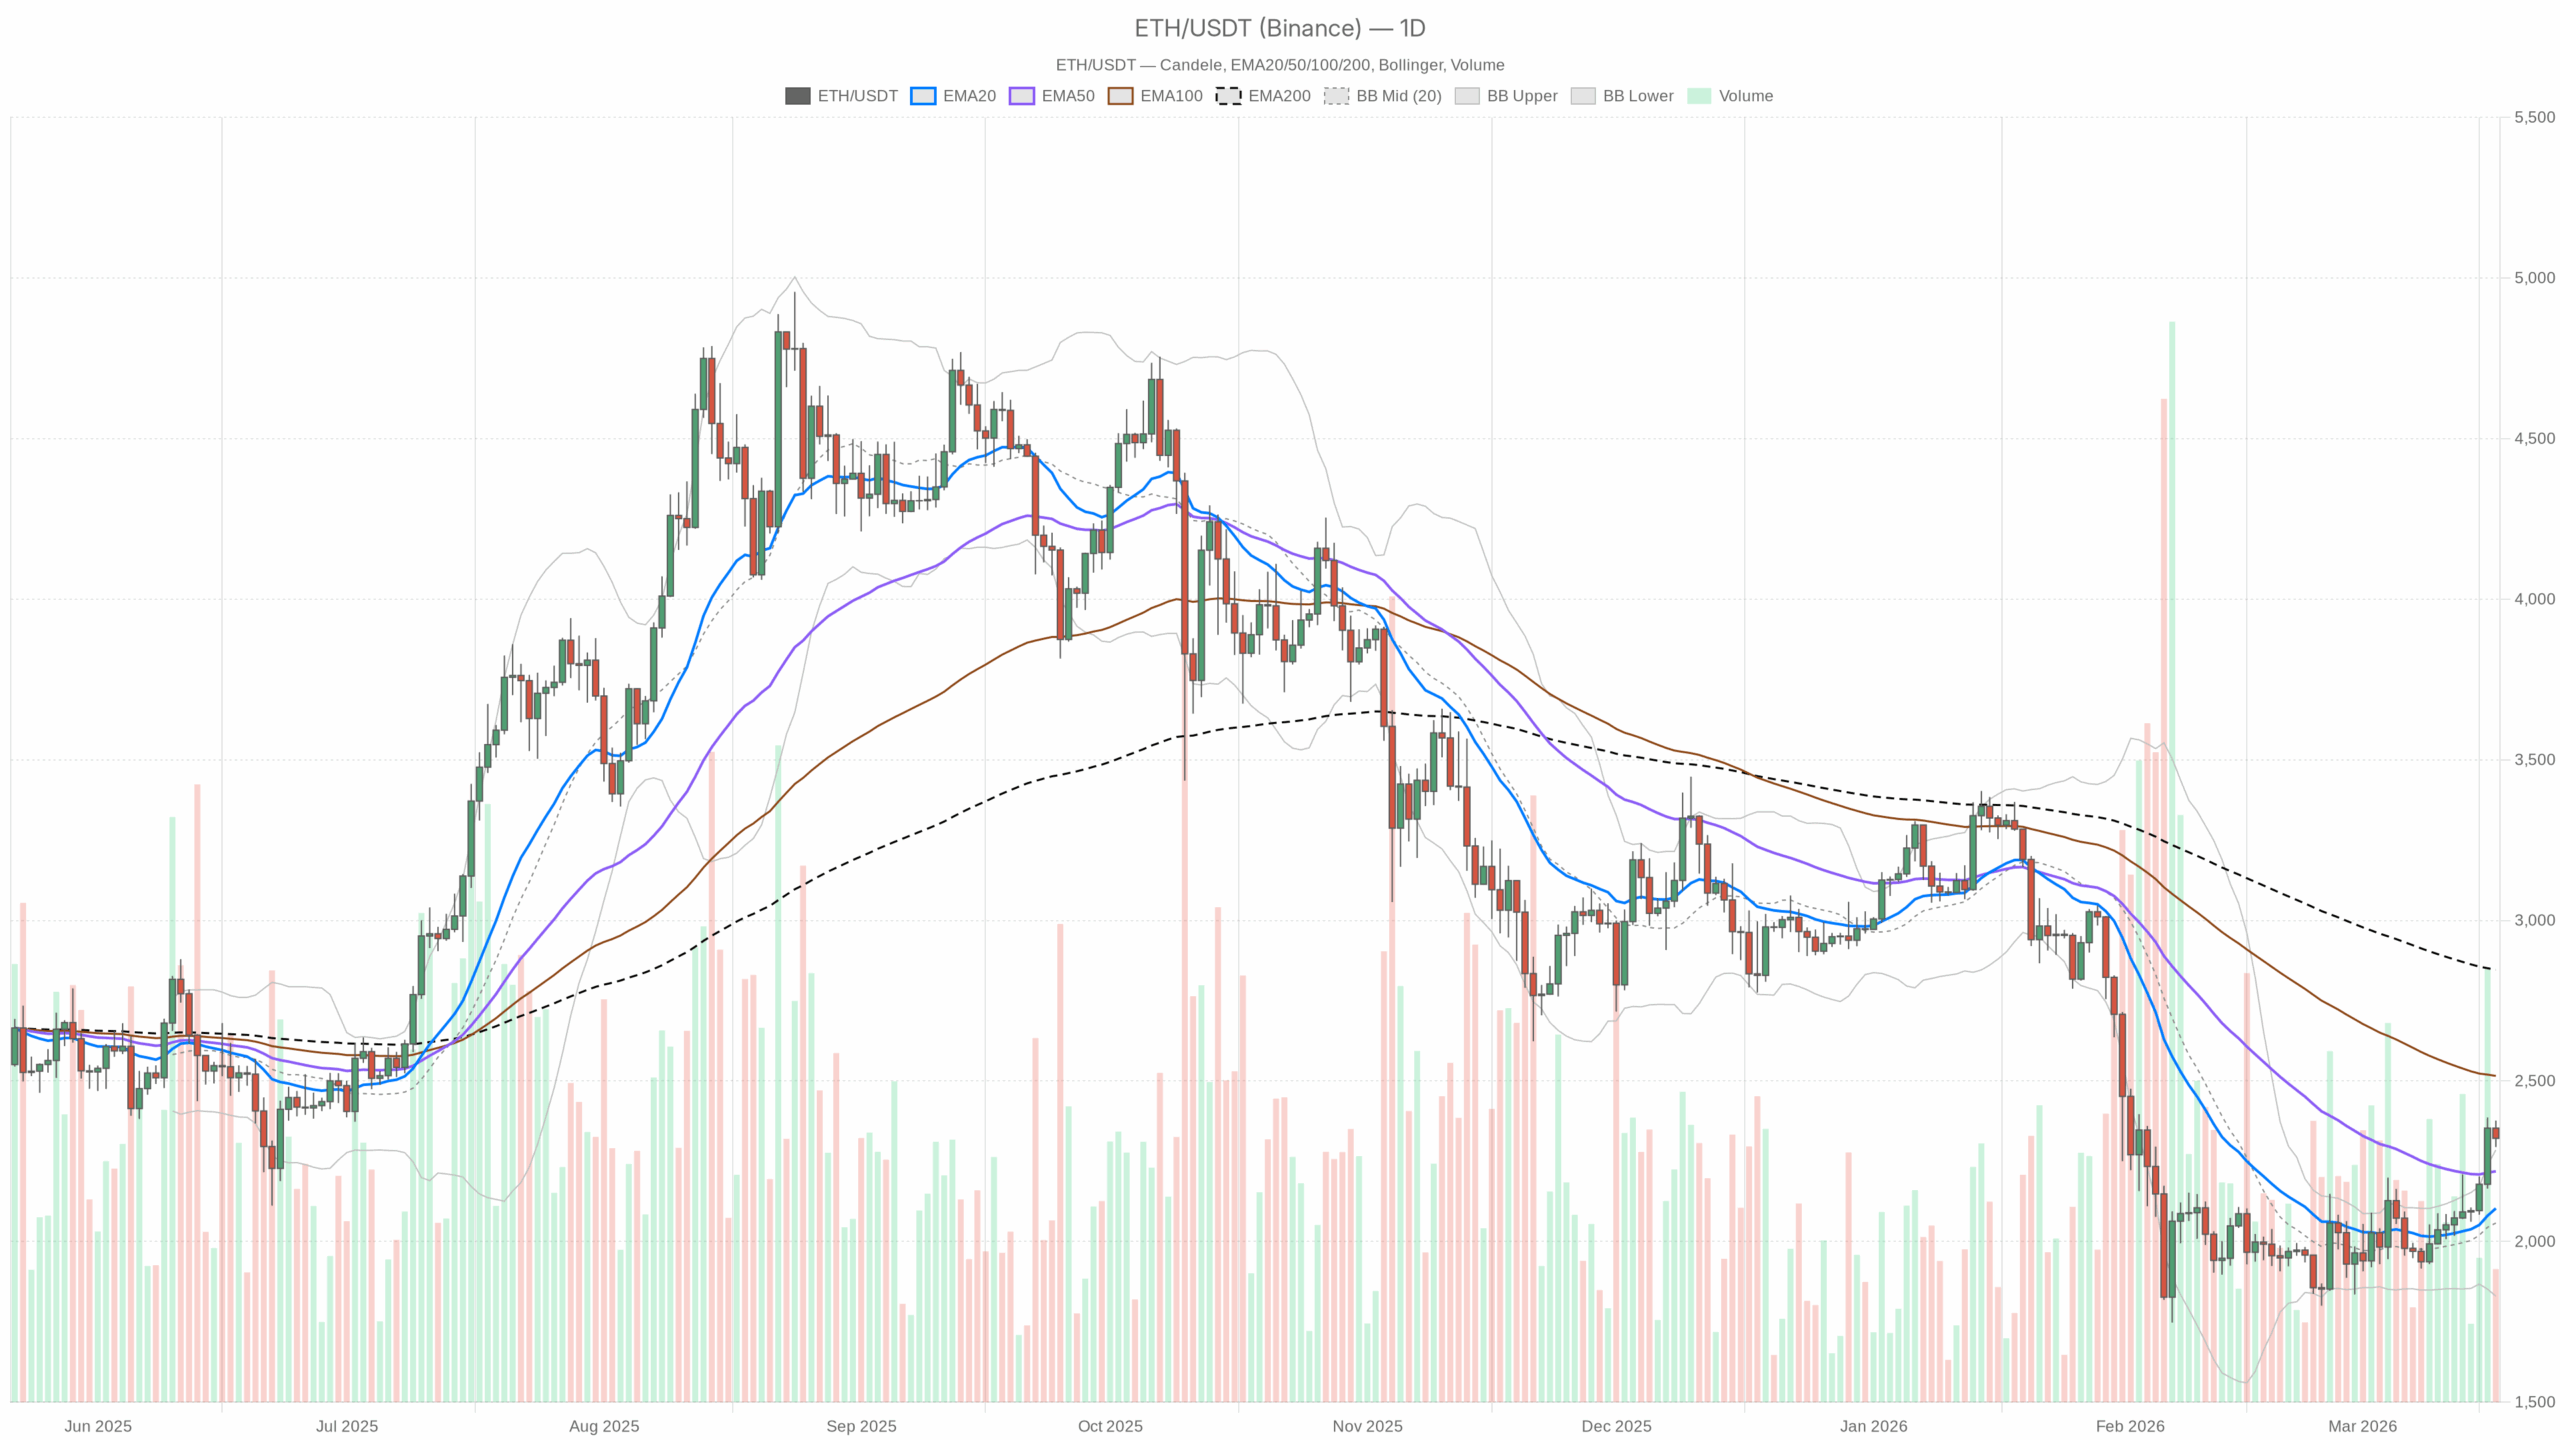 ETH/USDT daily chart with EMA20, EMA50 and volume”
loading=”lazy” />ETH/USDT — daily chart with candlesticks, EMA20/EMA50 and volume.
Daily trend: short-term bullish inside a damaged long-term structure
The dominant scenario on the daily timeframe is tactically bullish but structurally fragile.
ETH is closing at $2,321.27 with the following daily levels:
- EMA 20: $2,103.18
- EMA 50: $2,218.66
- EMA 200: $2,845.71
Price is above the 20-day and 50-day EMAs, but still far below the 200-day EMA.
How to read this: Short- and medium-term participants clearly have control; buyers have dragged ETH back above the fast and intermediate trend lines. However, being roughly $500+ under the 200-day means the long-term trend is still down and under repair. This is classic counter-trend recovery inside a broader bearish or corrective regime.
Daily RSI (momentum)
- RSI 14 (D1): 64.08
Momentum is firmly positive, leaning into bullish territory but not yet overbought.
What it implies: Buyers have the upper hand, and there is still room for price to push higher before the market becomes technically stretched. This is typical of a rally leg that has fuel left, but not one where everyone is already maxed out long.
Daily MACD (trend strength)
- MACD line: 33.48
- Signal line: -15.81
- Histogram: 49.29 (strongly positive)
The MACD line sitting well above the signal with a large positive histogram shows strong upside momentum behind the recent move.
What it implies: This is not a weak bounce; it is a fairly forceful impulse off the lows. When histogram bars are this elevated, the rally sequence is usually in full swing. However, it also means price is moving quickly and could be prone to sharp pullbacks once the impulse cools.
Daily Bollinger Bands (volatility & positioning)
- Middle band: $2,057.66
- Upper band: $2,285.17
- Lower band: $1,830.16
- Price: $2,321.27 (currently trading slightly above the upper band)
ETH is pushing through the upper Bollinger Band on the daily chart.
What it implies: Price is riding the edge of volatility expansion. In healthy uptrends, strong names can walk the band for days. That said, statistically this is also where mean-reversion traders start looking for counter-moves. It signals a strong bullish move that may be getting ahead of itself in the very short term.
Daily ATR (range & risk)
- ATR 14 (D1): $113.96
Daily volatility is elevated but not extreme for ETH at these price levels.
What it implies: A typical daily swing of around $110 either way is on the table. For traders, that means intraday entries and stops need to account for roughly a 5% daily noise band in either direction. Position sizing that ignores this can get shaken out on ordinary volatility.
Daily pivot levels (near-term map)
- Pivot point (PP): $2,330.69
- Resistance 1 (R1): $2,367.24
- Support 1 (S1): $2,284.73
ETH is trading just below the daily pivot and near the upper band area.
What it implies: The $2,330–2,335 zone is today’s immediate battleground. Holding above that pivot would confirm buyers maintaining short-term control. However, persistent rejection below it tilts the intraday bias back toward a sideways-to-lower session, even within the broader daily upswing.
1-hour chart: intraday trend supports the bullish daily bias
The 1-hour timeframe is bullish and broadly aligns with the daily upside bias, although momentum is cooling slightly.
- Price (H1 close): $2,322.39
- EMA 20: $2,313.78
- EMA 50: $2,255.85
- EMA 200: $2,139.21
Price is above all key EMAs on the hourly chart, with the short EMAs stacked bullishly above the longer ones.
What it implies: Intraday trend followers are long and in profit. Dips back toward the 20-EMA (around $2,314) are likely to attract buyers first. Deeper pullbacks toward the 50-EMA (around $2,256) would test how strong this intraday trend really is.
Hourly RSI
- RSI 14 (H1): 58.3
Momentum on the hourly chart is positive but not stretched.
What it implies: Bulls are in control on this timeframe, but momentum is more controlled than euphoric. There is room both for continuation higher and for a pause or sideways consolidation without immediately breaking the overall trend.
Hourly MACD
- MACD line: 21.62
- Signal line: 30.46
- Histogram: -8.84
The MACD histogram has turned slightly negative as the MACD line dips below the signal line.
What it implies: Short-term upside momentum is cooling. This does not invalidate the uptrend, but it signals a potential pause, shallow pullback, or range on the intraday tape rather than a straight-line extension higher from here.
Hourly Bollinger Bands
- Middle band: $2,326.91
- Upper band: $2,376.16
- Lower band: $2,277.66
- Price: $2,322.39 (near the middle band)
Price has mean-reverted back near the middle band after spending time near the upper band earlier.
What it implies: The intraday move is normalizing. The market is digesting prior gains rather than launching a fresh momentum leg right this second. That is typical before either a continuation breakout or a deeper shakeout.
Hourly ATR & pivot
- ATR 14 (H1): $26.98
- Pivot point (PP): $2,321.40
- R1: $2,323.61
- S1: $2,320.17
Volatility on the hourly is modest, with a roughly $27 expected range per hour.
What it implies: The market is liquid and moving, but not in a panic. The current price is hugging the hourly pivot band, so the market is deciding in real time whether to treat this region as a springboard (above R1) or as a ceiling (slipping back under S1). Very short-term traders will anchor around this micro-range.
15-minute chart: neutral, more about execution than direction
The 15-minute chart is neutral and mainly useful for timing rather than for defining bias.
- Price (M15 close): $2,322.24
- EMA 20: $2,324.81
- EMA 50: $2,325.36
- EMA 200: $2,253.05
Price is sandwiched right around the 20- and 50-EMAs, which are essentially flat, while still well above the 200-EMA.
What it implies: Very short-term traders are in a mini range. The immediate impulse up has stalled, but there is no confirmed intraday breakdown either. Above the 200-EMA, the path of least resistance remains up, but entries and exits need precision.
15-minute RSI & MACD
- RSI 14 (M15): 47.77
- MACD line: -2.07
- Signal line: -3.51
- Histogram: 1.44 (slightly positive)
RSI is mid-range and the MACD histogram has just turned mildly positive.
What it implies: Short-term pressure has eased; the market is catching its breath. There is a slight intraday bullish tilt, but nothing strong enough to override the bigger-picture hourly and daily context. This is typical chop where liquidity providers are active and directional traders should be patient.
15-minute Bollinger Bands, ATR, and pivot
- Middle band: $2,318.63
- Upper band: $2,336.60
- Lower band: $2,300.66
- ATR 14 (M15): $11.89
- Pivot point (PP): $2,321.35
- R1: $2,323.51
- S1: $2,320.07
Price is hovering right around the 15-minute pivot with relatively tight bands and a modest $12 expected range per bar.
What it implies: Microstructure is balanced. The next push through either the upper band and $2,336 region or the lower band and $2,301 region will likely come with a short volatility burst and define the next intraday leg.
Macro context: capital cautious, ETH still a beta play
While ETH is recovering, the broader market backdrop is still cautious. As of 2024, the setup remains similar across major cycles.
- Total market cap: around $2.62T, up about 1.7% in 24 hours
- Bitcoin dominance: about 56.7%
- ETH share of market cap: around 10.7%
- Fear & Greed: 28 (Fear)
What it implies: We are in a phase where the market is selectively risk-on. Bitcoin is still the main risk barometer, and Ethereum trades as high beta to that move. However, the sentiment profile (Fear) signals that larger players are not in full-blown chase mode yet. Rallies in ETH can extend, but they can also reverse quickly if BTC loses its footing.
On-chain and DeFi activity remains constructive with high fee generation on Uniswap and Curve, but short-term pricing is still much more about macro risk conditions and ETF or liquidity narratives than about marginal DeFi metrics.
Main scenarios for Ethereum price today
Based on the daily timeframe, the main scenario is tactically bullish with a bias for continuation higher, but within a still-vulnerable long-term structure.
Bullish scenario (primary)
In the bullish case, ETH holds above the key short-term supports and extends this impulse leg.
Key conditions and levels:
- Daily price stays above the EMA 20 (around $2,103) and preferably above the EMA 50 (around $2,219).
- RSI on the daily remains in the 60–70 band without a sharp divergence or breakdown.
- MACD histogram stays positive on the daily, confirming trend persistence.
- Intraday, the hourly chart keeps price trading above the H1 EMA 50 (around $2,256).
Upside roadmap:
- First, reclaim and hold above the daily pivot at $2,330–2,335.
- Next, test the intraday resistance zone around $2,360–2,370, which aligns with R1 on the daily chart and the upper regions of the H1 Bollinger Band.
- If momentum persists, a push toward the $2,450–2,500 region becomes plausible as the next major liquidity pocket.
What would invalidate the bullish scenario today:
- A clean break back below $2,285 (daily S1) that holds into the close.
- Hourly structure turning decisively bearish, with price below the H1 EMA 50 and RSI slipping into persistent sub-45 territory.
- Daily MACD histogram rolling over hard toward zero, showing the impulse has run out of steam.
Bearish scenario (counter-trend today, but aligned with long-term damage)
The bearish case leans on the idea that ETH is overextended against its longer-term downtrend and extended beyond its daily Bollinger upper band, setting up a mean-reversion move.
Key conditions and triggers:
- Failure to hold above the $2,330 pivot, with repeated intraday rejections.
- Break below $2,285 (daily S1) turning that area into resistance.
- Hourly MACD staying negative and RSI rolling over from current mid-50s toward the 40 zone.
Downside roadmap:
- Initial pullback into the $2,250–2,260 region, which is the H1 EMA 50 area and a mid-range support.
- If sellers press further, a test of the $2,180–2,200 band becomes likely, which is roughly above but near the daily EMA 50.
- A deeper flush could eventually probe near the $2,100 zone (daily EMA 20), which would be a critical line for bulls in this structure.
What would invalidate the bearish scenario today:
- Strong expansion above $2,370 with hourly closes holding above that level.
- Hourly RSI pushing and sustaining above 65–70 accompanied by a renewed positive MACD cross.
- Daily candle closing solidly above the upper Bollinger Band with increasing volume, signaling a trend-following breakout rather than a simple overextension.
How to think about positioning, risk, and uncertainty
For traders looking at Ethereum price today, the message is nuanced and demands respect for both trend and volatility.
- Bias: The path of least resistance in the near term is up, backed by bullish daily momentum (RSI and MACD) and supportive hourly trend structure (EMAs).
- Structural risk: ETH is still well below its 200-day EMA. That is a reminder that the market is rallying inside a bigger, unresolved corrective structure. The higher traders chase, the more they rely on this impulse evolving into a full trend reversal.
- Volatility: With a daily ATR near $114 and hourly ATR near $27, intraday swings can be sharp enough to test risk limits quickly, especially with tight stops.
- Sentiment: Fear-dominated sentiment means the market can overshoot both ways, panic out on dips, or chase hard once key resistance breaks. Position sizes and time horizons should reflect that instability.
In practical terms, short- and medium-term traders will likely treat pullbacks toward the $2,260–2,280 area as a stress test of this rally. If those levels hold with supportive hourly momentum, the bullish scenario retains the upper hand. If they give way with heavy selling and BTC also weakens, the market is signaling that the longer-term downtrend still has more to say.
Whichever side traders lean toward, the critical point today is to respect the range of outcomes. ETH can trend, but it can also mean-revert violently from an overextended daily upper band. The edge comes from aligning timeframe, risk limits, and key levels, not from assuming a single guaranteed direction.
You May Also Like
XRPL Validator Reveals Why He Just Vetoed New Amendment

XRP vs Pepeto: XRP Ledger Expands But Pepeto Presale is the Clear Winner for 2026