The post Solana Price at $116: Breakout Launchpad… or Breakdown Before the Next Leg? appeared first on Coinpedia Fintech News After weeks of persistent selling The post Solana Price at $116: Breakout Launchpad… or Breakdown Before the Next Leg? appeared first on Coinpedia Fintech News After weeks of persistent selling

Solana Price at $116: Breakout Launchpad… or Breakdown Before the Next Leg?

WisdomTree tokenized funds on Solana

The post Solana Price at $116: Breakout Launchpad… or Breakdown Before the Next Leg? appeared first on Coinpedia Fintech News

After weeks of persistent selling pressure and failed recovery attempts, Solana holders are once again staring at a brutal question: Is this consolidation the final reset before a powerful breakout in Solana price or just the pause before another downside flush?

With Solana price today hovering near $116, the market is approaching a point where indecision will no longer be an option. This article is no longer about optimism or fear. It’s about structure and price action.

Why This Zone Matters More Than It Looks

From a technical perspective, momentum still appears fragile but cracks are forming beneath the surface.

Among the top technical indiactors on weekly chart, RSI is printing around 36, hovering just above oversold territory. Historically, this region has often marked seller exhaustion rather than trend continuation, particularly when price holds above a known demand zone. Meanwhile, MACD remains below the signal line, but the histogram is flattening, showing that bearish momentum is slowing rather than accelerating.

Solana Price at $116: Breakout Launchpad… or Breakdown Before the Next Leg?

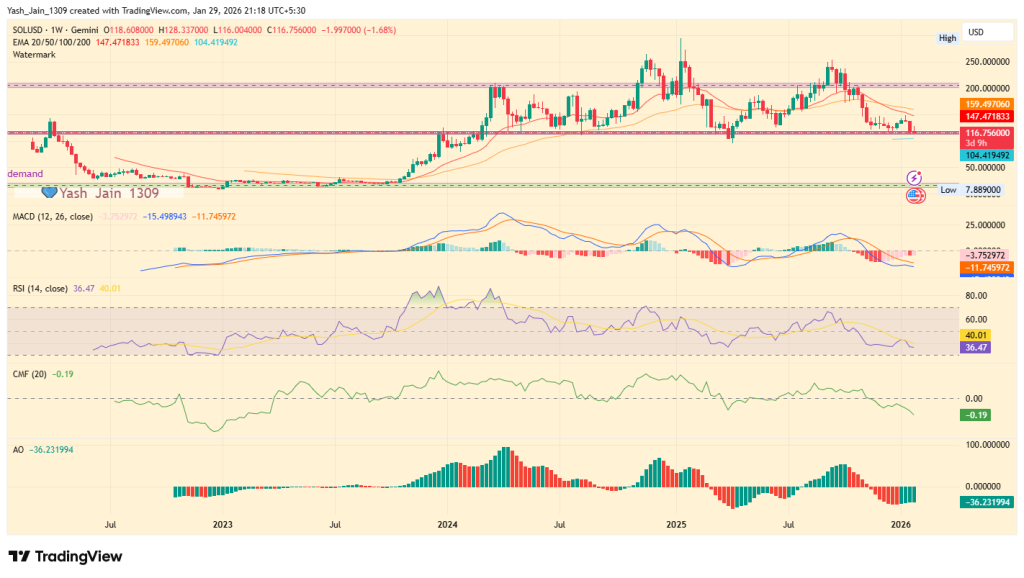
The Awesome Oscillator (AO) reinforces this view. Although still deep in negative territory, the red bars are shrinking, hinting that downside force is losing intensity. At the same time, Chaikin Money Flow (CMF) sits near -0.19, signaling capital outflows but notably not aggressive liquidation. In past cycles, similar CMF behavior during price compression has preceded volatility expansion.

Price action itself adds another layer. With CMP at $116, Solana price is sitting directly inside a historically defended zone that previously acted as a springboard for larger moves since last 24 months.

The On-Chain Signal Most Are Missing

While Solana price charts suggest hesitation, on-chain data paints a very different picture.

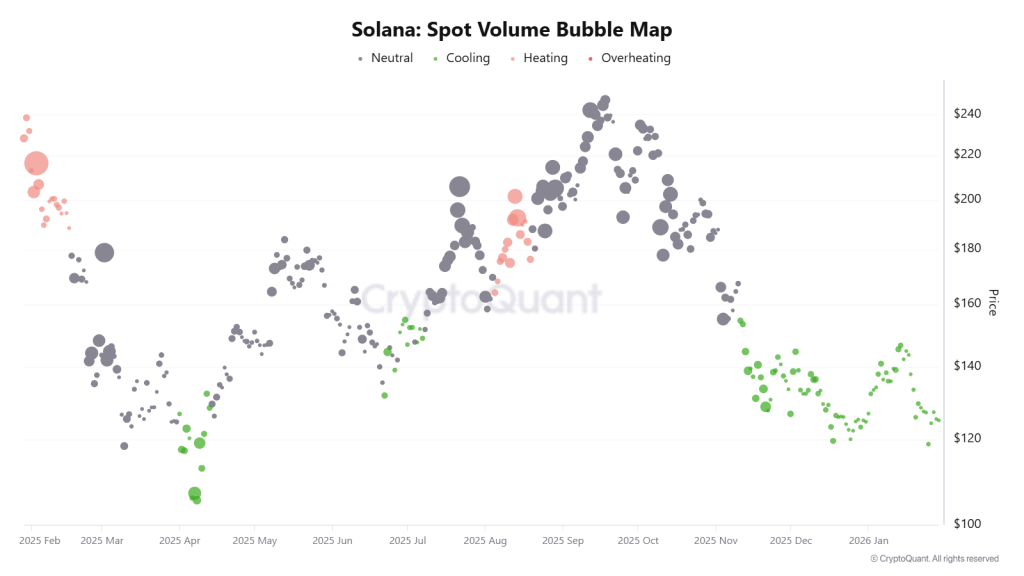
Both spot and futures Volume Bubble Maps show dense clusters of green bubbles between $110 and $150, signaling high-volume activity during a “cooling” phase. This pattern typically reflects supply absorption rather than speculative excess. In simple terms, strong hands appear to be accumulating while volatility remains suppressed.

Solana Price at $116: Breakout Launchpad… or Breakdown Before the Next Leg?

Derivatives data strengthens this narrative. Spot Taker CVD has turned positive and continues to rise, confirming a Taker Buy Dominant environment since early January. Even more telling, Futures Taker CVD has maintained this bullish bias since December 2025, suggesting sustained institutional conviction rather than short-term positioning.

Solana Price at $116: Breakout Launchpad… or Breakdown Before the Next Leg?

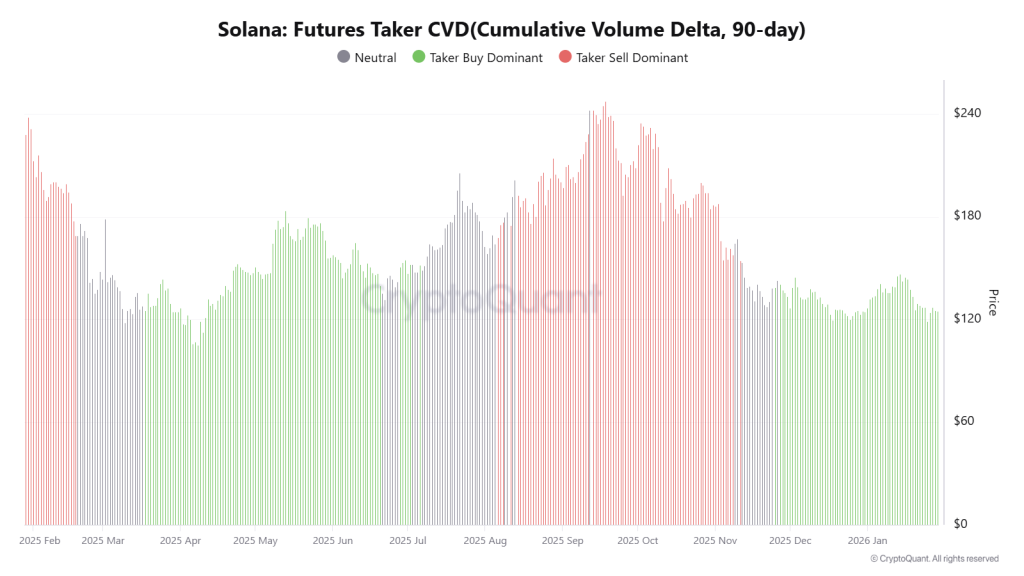
When spot and futures demand align like this near key support, the market is often coiling for a decisive move. 

The Levels That Decide the Outcome

If buyers defend current levels:

First upside SOL/USD target: $135, where short-term resistance and EMA pressure converge

Breakout confirmation: $150–$180, aligned with heavy on-chain accumulation zones

If support gives way:

Immediate downside risk: $104, a prior weekly demand shelf

Deeper breakdown zone: $88–$95, the last structural base before the 2024 expansion leg

Based on the present SOL price prediction outlook it suggests, there’s little room left for sideways drift only, when this get’s passed it will choose direction.

Disclaimer: The articles reposted on this site are sourced from public platforms and are provided for informational purposes only. They do not necessarily reflect the views of MEXC. All rights remain with the original authors. If you believe any content infringes on third-party rights, please contact service@support.mexc.com for removal. MEXC makes no guarantees regarding the accuracy, completeness, or timeliness of the content and is not responsible for any actions taken based on the information provided. The content does not constitute financial, legal, or other professional advice, nor should it be considered a recommendation or endorsement by MEXC.

You May Also Like

BlackRock Increases U.S. Stock Exposure Amid AI Surge

BlackRock Increases U.S. Stock Exposure Amid AI Surge

The post BlackRock Increases U.S. Stock Exposure Amid AI Surge appeared on BitcoinEthereumNews.com. Key Points: BlackRock significantly increased U.S. stock exposure. AI sector driven gains boost S&P 500 to historic highs. Shift may set a precedent for other major asset managers. BlackRock, the largest asset manager, significantly increased U.S. stock and AI sector exposure, adjusting its $185 billion investment portfolios, according to a recent investment outlook report.. This strategic shift signals strong confidence in U.S. market growth, driven by AI and anticipated Federal Reserve moves, influencing significant fund flows into BlackRock’s ETFs. The reallocation increases U.S. stocks by 2% while reducing holdings in international developed markets. BlackRock’s move reflects confidence in the U.S. stock market’s trajectory, driven by robust earnings and the anticipation of Federal Reserve rate cuts. As a result, billions of dollars have flowed into BlackRock’s ETFs following the portfolio adjustment. “Our increased allocation to U.S. stocks, particularly in the AI sector, is a testament to our confidence in the growth potential of these technologies.” — Larry Fink, CEO, BlackRock The financial markets have responded favorably to this adjustment. The S&P 500 Index recently reached a historic high this year, supported by AI-driven investment enthusiasm. BlackRock’s decision aligns with widespread market speculation on the Federal Reserve’s next moves, further amplifying investor interest and confidence. AI Surge Propels S&P 500 to Historic Highs At no other time in history has the S&P 500 seen such dramatic gains driven by a single sector as the recent surge spurred by AI investments in 2023. Experts suggest that the strategic increase in U.S. stock exposure by BlackRock may set a precedent for other major asset managers. Historically, shifts of this magnitude have influenced broader market behaviors as others follow suit. Market analysts point to the favorable economic environment and technological advancements that are propelling the AI sector’s momentum. The continued growth of AI technologies is…
Share
BitcoinEthereumNews2025/09/18 02:49
U.S. Court Dismisses Major XRP Investor Lawsuit

U.S. Court Dismisses Major XRP Investor Lawsuit

The post U.S. Court Dismisses Major XRP Investor Lawsuit appeared on BitcoinEthereumNews.com. Ninth Circuit Dismisses Class Action Against Ripple, Clearing Legal
Share
BitcoinEthereumNews2026/01/30 15:35
Trading Moment: Global Asset Market Turmoil Causes BTC Confidence to Collapse, $81,000 Becomes the Last Line of Defense Against a Plunge

Trading Moment: Global Asset Market Turmoil Causes BTC Confidence to Collapse, $81,000 Becomes the Last Line of Defense Against a Plunge

Daily market data review and trend analysis, produced by PANews. 1. Market Observation Amidst a complex interplay of macroeconomic and geopolitical factors, global
Share
PANews2026/01/30 15:08