

FedEx Stock Slides $12 From Session High as Sellers Take Over

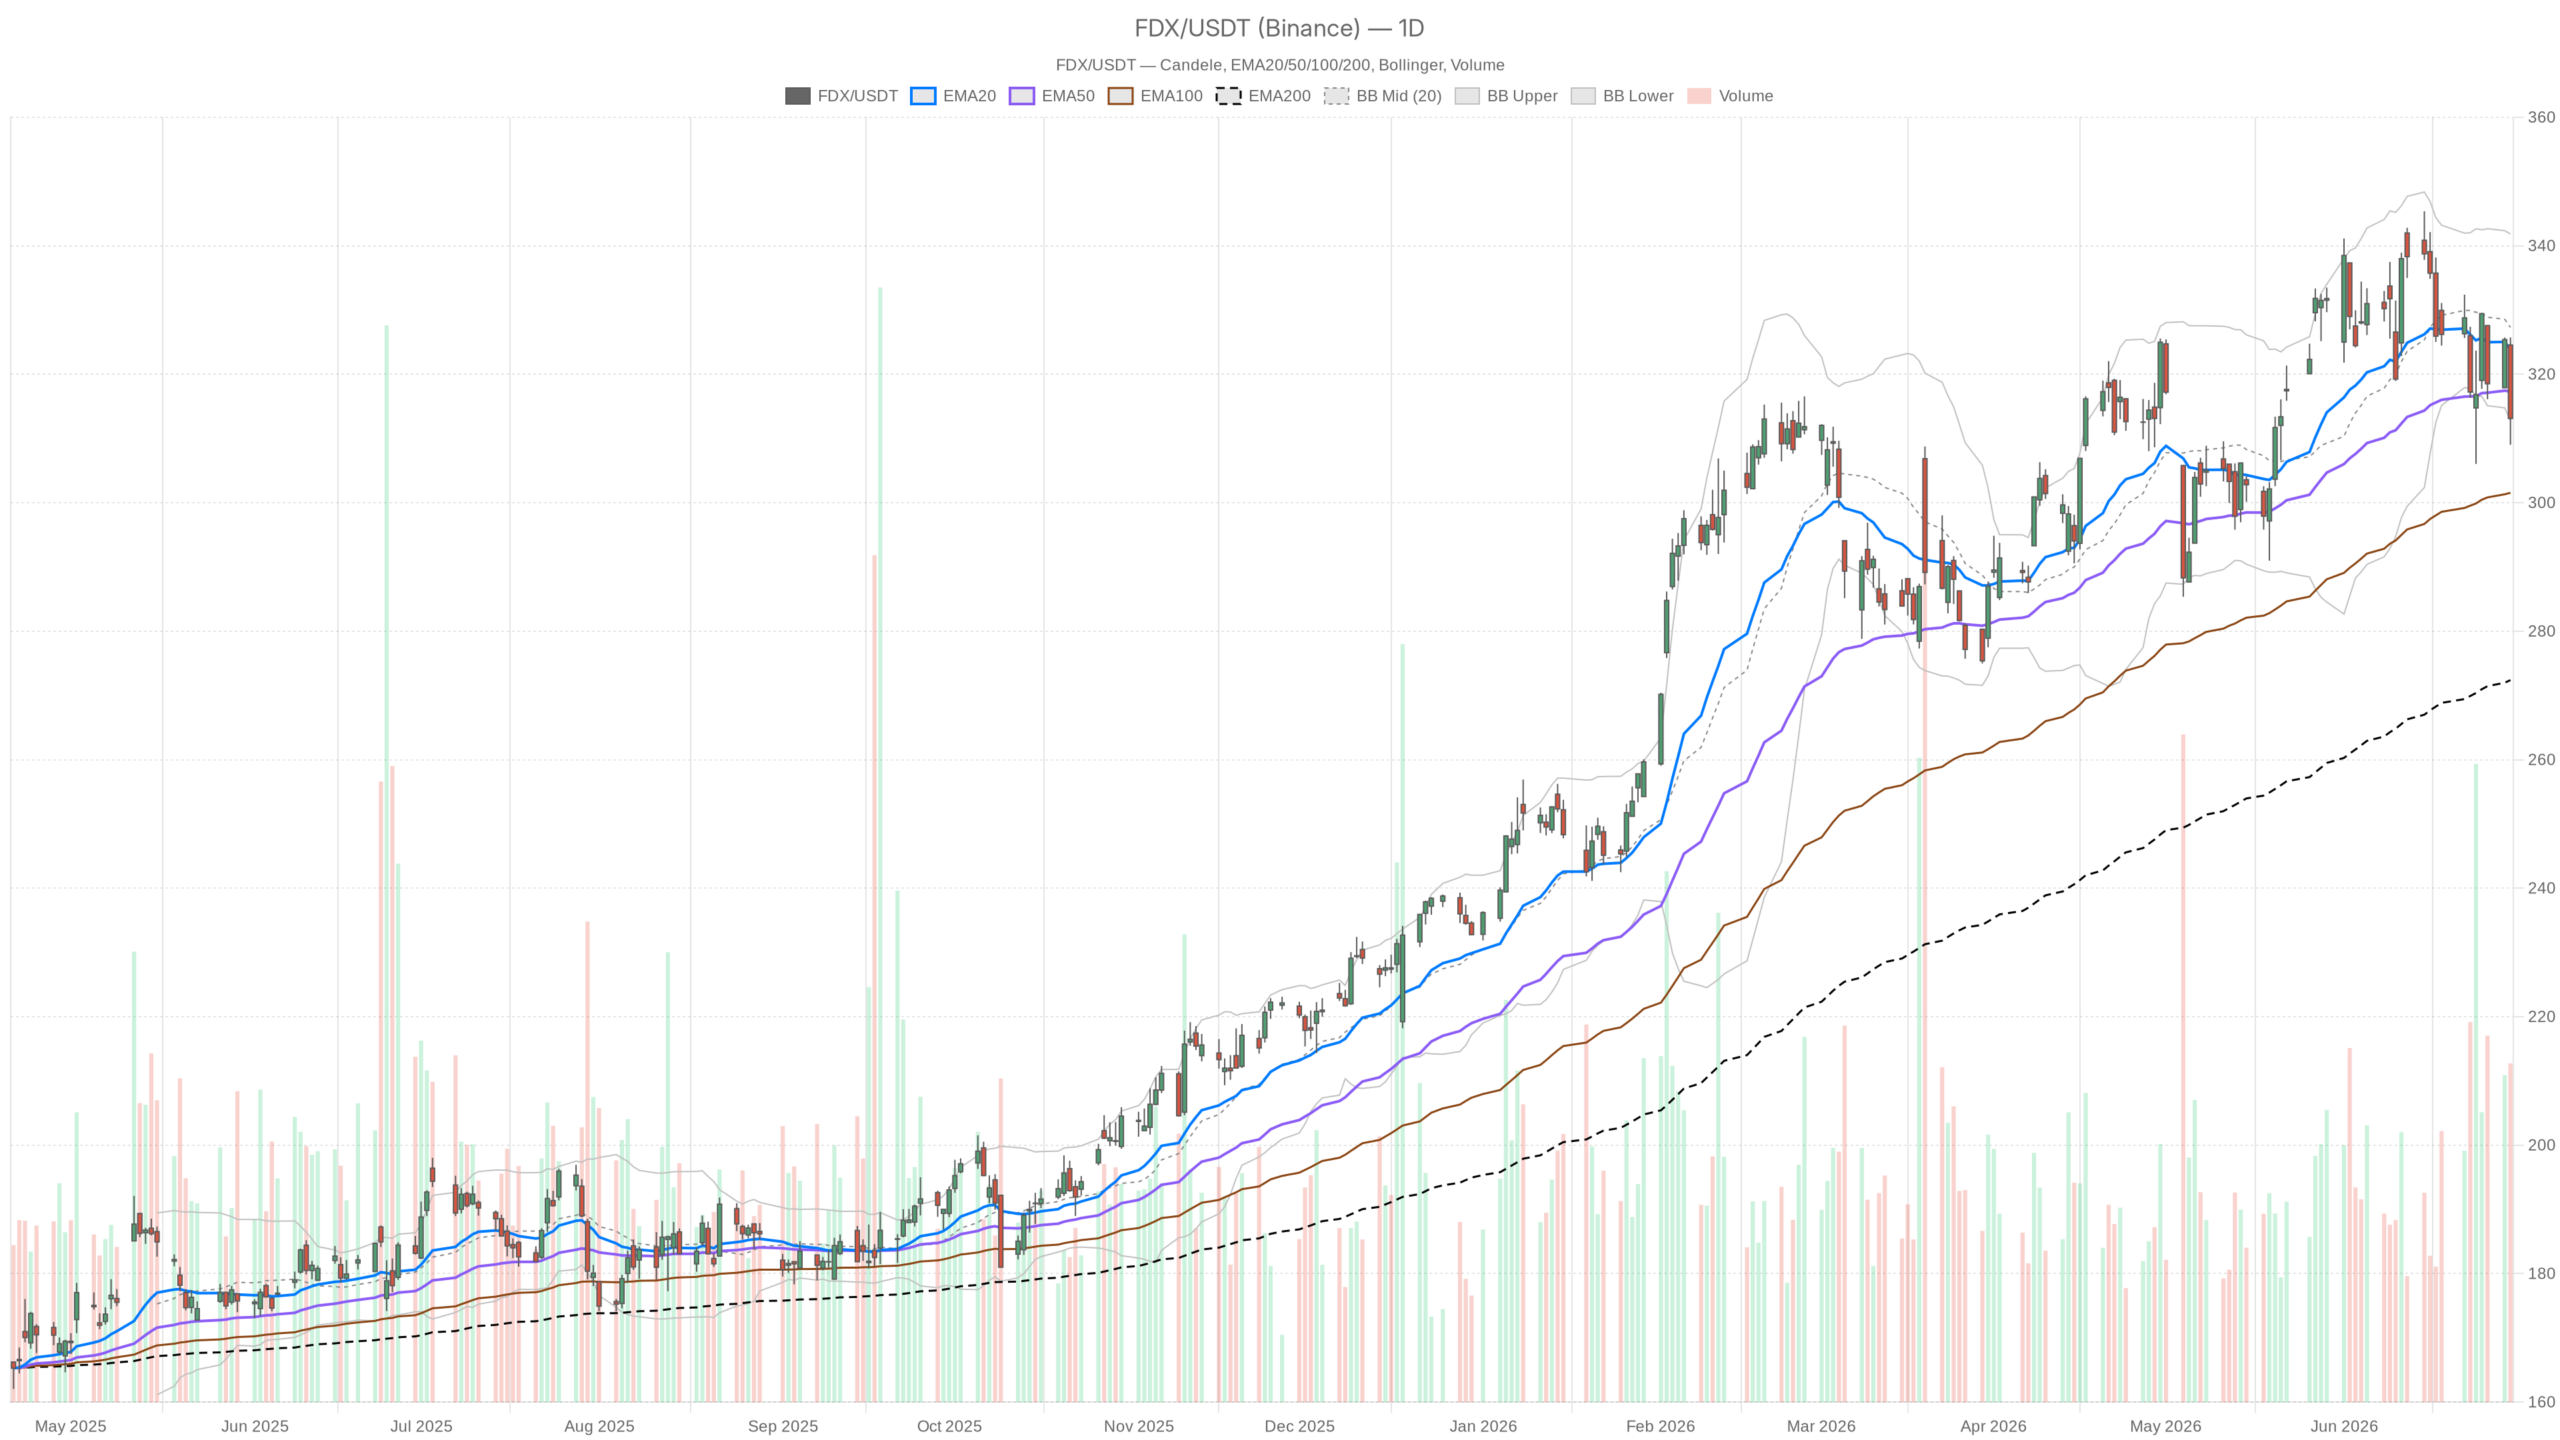
FedEx Stock closed at $313.13 on June 30, well off its $325.73 session high. The sharp-bodied rejection candle signals active selling pressure near the top of the recent range. FDX now sits at a technically fragile juncture where intraday momentum warns of further downside.
 FDX — daily chart with candlesticks, EMA20/EMA50 and volume.
Key takeaways
- FDX closed at $313.13 on June 30, rejecting a session high of $325.73 in a sharp intraday selloff.
- The daily RSI sits at 44.13 with a negative MACD histogram, confirming fading momentum without an oversold signal.
- Hourly structure is decisively bearish, with price below all three major EMAs and negative histogram momentum accelerating.
- The $315.96 daily pivot is the critical level — reclaiming it on a close shifts the bias back to neutral.
- FedEx Freight’s underlying revenue grew 4.8%, despite a headline profit drop driven by one-time spinoff costs.
FedEx Stock Daily Structure: Support Holds, But Momentum Fades
FedEx Stock’s daily trend has not broken down structurally. The 200-day EMA sits far lower at $272.40, confirming the long-term framework remains intact. However, the stock is compressing toward a decision zone, and the weight of evidence is tilting bearish.
EMA Stack Under Pressure
On the daily timeframe, FDX trades below its 20-day EMA at $323.90 and its Bollinger midline at $327.30. For now, the 50-day EMA at $317.28 remains the last meaningful dynamic support between current price and a broader breakdown. A close below that level would materially weaken the daily structure.
Momentum Indicators Flash Warning
The daily RSI at 44.13 reflects fading momentum without entering oversold territory. This reading warns against assuming the dip is a buying opportunity. Meanwhile, the MACD line is marginally positive at 0.39, but the signal line at 2.76 is well ahead of it. The histogram has turned negative at -2.37. That divergence confirms upward momentum from earlier weeks is unwinding. This setup is not outright bearish, yet the direction of travel is unambiguously lower.
Bollinger Bands and Pivot Points
Meanwhile, the daily lower Bollinger band sits at $312.75 — nearly where FDX closed on June 30. Closes at the lower band do not automatically signal capitulation. They mark a point where the market pauses to reassess. The daily ATR of $11.59 confirms meaningful volatility. Traders should not underestimate the risk of sharp intraday reversals.
Daily pivot analysis places the pivot point at $315.96, with resistance at $322.90 and support at $306.20. FDX sits just below the pivot, placing the burden of proof on bulls. Reclaiming $315.96 on a close would shift the short-term bias back toward neutral. Failure to do so keeps $306.20 in play as the next downside reference.
FedEx Stock Intraday Structure: Hourly Chart Turns Decidedly Bearish
FedEx Stock’s intraday picture is more bearish than the daily chart suggests. The hourly setup weakens the daily case rather than reinforcing it. Every short-term recovery attempt faces layered overhead resistance.
Bearish EMA Stack and RSI
On the 1H chart, FDX trades below all three major EMAs — the 20-period at $317.63, the 50-period at $321.43, and the 200-period at $323.28. This stacked structure means every bounce runs into multiple resistance layers. The 1H RSI has dropped to 39.25, approaching oversold without reaching it. In a bearish trend, RSI can linger in this zone for extended periods before any recovery.
MACD Confirms Selling Depth
The 1H MACD reinforces the bearish read. Its line sits at -3.01, the signal at -1.99, and the histogram at -1.02. Negative momentum on the hourly is accelerating. This suggests the intraday selling has depth and is not merely a brief correction. The 1H Bollinger midline at $319.10 represents the first meaningful recovery target. Until FDX reclaims that level, the hourly path of least resistance remains lower.
15-Minute Chart Hints at Short-Term Stabilization
Notably, the 15-minute chart offers one small divergence from the bearish 1H picture. The 15m MACD histogram has turned positive at 0.55, even as the MACD line remains negative at -1.45. This points to a very short-term stabilization attempt. The 15m RSI at 45.11 is neutral, offering no directional edge. At best, the setup signals consolidation near the $311.54–$313.66 zone. It is not a reversal signal — only a pause in selling pressure.
Fundamental Backdrop: FedEx Freight Earnings in Focus
On the fundamental side, FedEx Freight’s first post-spinoff earnings report landed on June 25. The headline was complicated, yet the underlying business trend appears intact.
Operating income dropped nearly 67% in Q4, dragged down by $205 million in spinoff-related costs. However, revenue rose 4.8% to $2.4 billion. The company also guided for profit margin growth of over 9% in the second half — up more than a point from last year. Bank of America maintained a Buy rating on FedEx Freight following the report. In short, the spinoff costs are real but transitory. The underlying growth trend limits the long-term damage from the headline profit drop.
Additionally, FDX is entering the Q2 earnings season spotlight. Given the current technical softness, any disappointment in the upcoming earnings print could accelerate downside. Conversely, a stronger-than-expected result could rapidly clear the overhead EMA resistance cluster.
FedEx Stock Scenarios: Bull vs. Bear Case
FedEx Stock faces two credible paths forward, but the bearish case carries more near-term weight. Both scenarios can develop quickly given elevated daily volatility.
Bullish Scenario
A daily close back above the $315.96 pivot, ideally with a recovery toward the 50-day EMA at $317.28, would suggest the June 30 selloff was month-end noise rather than a structural shift. Above that, the 20-day EMA at $323.90 becomes the next target. Solid Q2 guidance and confirmation that FedEx Freight spinoff costs are one-time items would materially strengthen the fundamental case. In this scenario, FDX builds a base above $315 and works toward the Bollinger midline near $327.
Bearish Scenario
In contrast, the bearish case becomes more credible if FDX fails to reclaim the daily pivot while the 1H EMA stack continues pressing lower. A sustained close below the lower Bollinger band at $312.75 would shift the daily regime from neutral toward bearish. Below daily S1 support at $306.20, the next reference is the psychological $300 level. An earnings disappointment or signs that the spinoff is creating more structural disruption than priced would likely catalyze that move.
Key Levels and Volatility Outlook for FDX
Overall, FedEx Stock is at a technically sensitive juncture. The daily regime is neutral, but the weight of evidence tilts short-term risk toward the downside. A rejection candle near session highs, a negative MACD histogram, price pressed against the lower Bollinger band, and a heavily bearish hourly structure all point in that direction.
The 15-minute stabilization offers modest tactical relief — not a trend reversal. Positioning ahead of earnings requires caution. With a daily ATR above $11, both scenarios can develop quickly. The key level is $315.96 on the daily close: above it, the bulls have a chance to regroup. Below it, the bears remain firmly in control.
FAQ
What is the most important level for FedEx Stock right now?
The $315.96 daily pivot point is the critical short-term level. A daily close above it would shift the bias back toward neutral-to-constructive. Failure to reclaim it keeps downside support at $306.20 in play.
Is FedEx Stock’s long-term trend still intact?
Yes. The 200-day EMA at $272.40 remains far below current price, confirming the long-term structure is not yet threatened. The current weakness is a tactical compression within a broader intact framework.
How did FedEx Freight’s earnings impact FDX?
FedEx Freight reported a 67% drop in Q4 operating income due to $205 million in one-time spinoff costs. However, revenue rose 4.8% to $2.4 billion, and the company guided for improving margins in the second half. Bank of America maintained a Buy rating, suggesting the market views the costs as transitory.
What would turn the FedEx Stock outlook decisively bearish?
A sustained close below the lower Bollinger band at $312.75, followed by a break of S1 support at $306.20, would shift the daily regime toward bearish. An earnings disappointment would likely accelerate that move toward the $300 level.
Disclaimer: This article is for informational purposes only and does not constitute financial advice, an investment recommendation, or a solicitation to buy or sell any financial instrument or cryptocurrency. The analysis provided is not indicative of future results. Investing in crypto assets and financial markets carries a high risk of capital loss. Always do your own research (DYOR) and consult a qualified financial advisor before making any decision.
Article produced with the assistance of artificial intelligence and reviewed by the editorial team.


You May Also Like

Ethereum backers launch nonprofit to lead institutional adoption efforts

Securitize prepares for its NYSE debut! What does Wall Street’s tokenization test mean for investors?


