

Opendoor shares at $4.61: the daily chart is bearish, but is the hourly chart setting up for a breakout?

Opendoor shares closed the session on 15 June 2026 at $4.61, unable to break higher but also to sell off decisively. The daily structure is bearish: the main moving averages all remain above the price and momentum has not yet reversed. In the short term, however, the hourly timeframe shows signs of a timid recovery, while the fundamental backdrop is heating up with new catalysts.
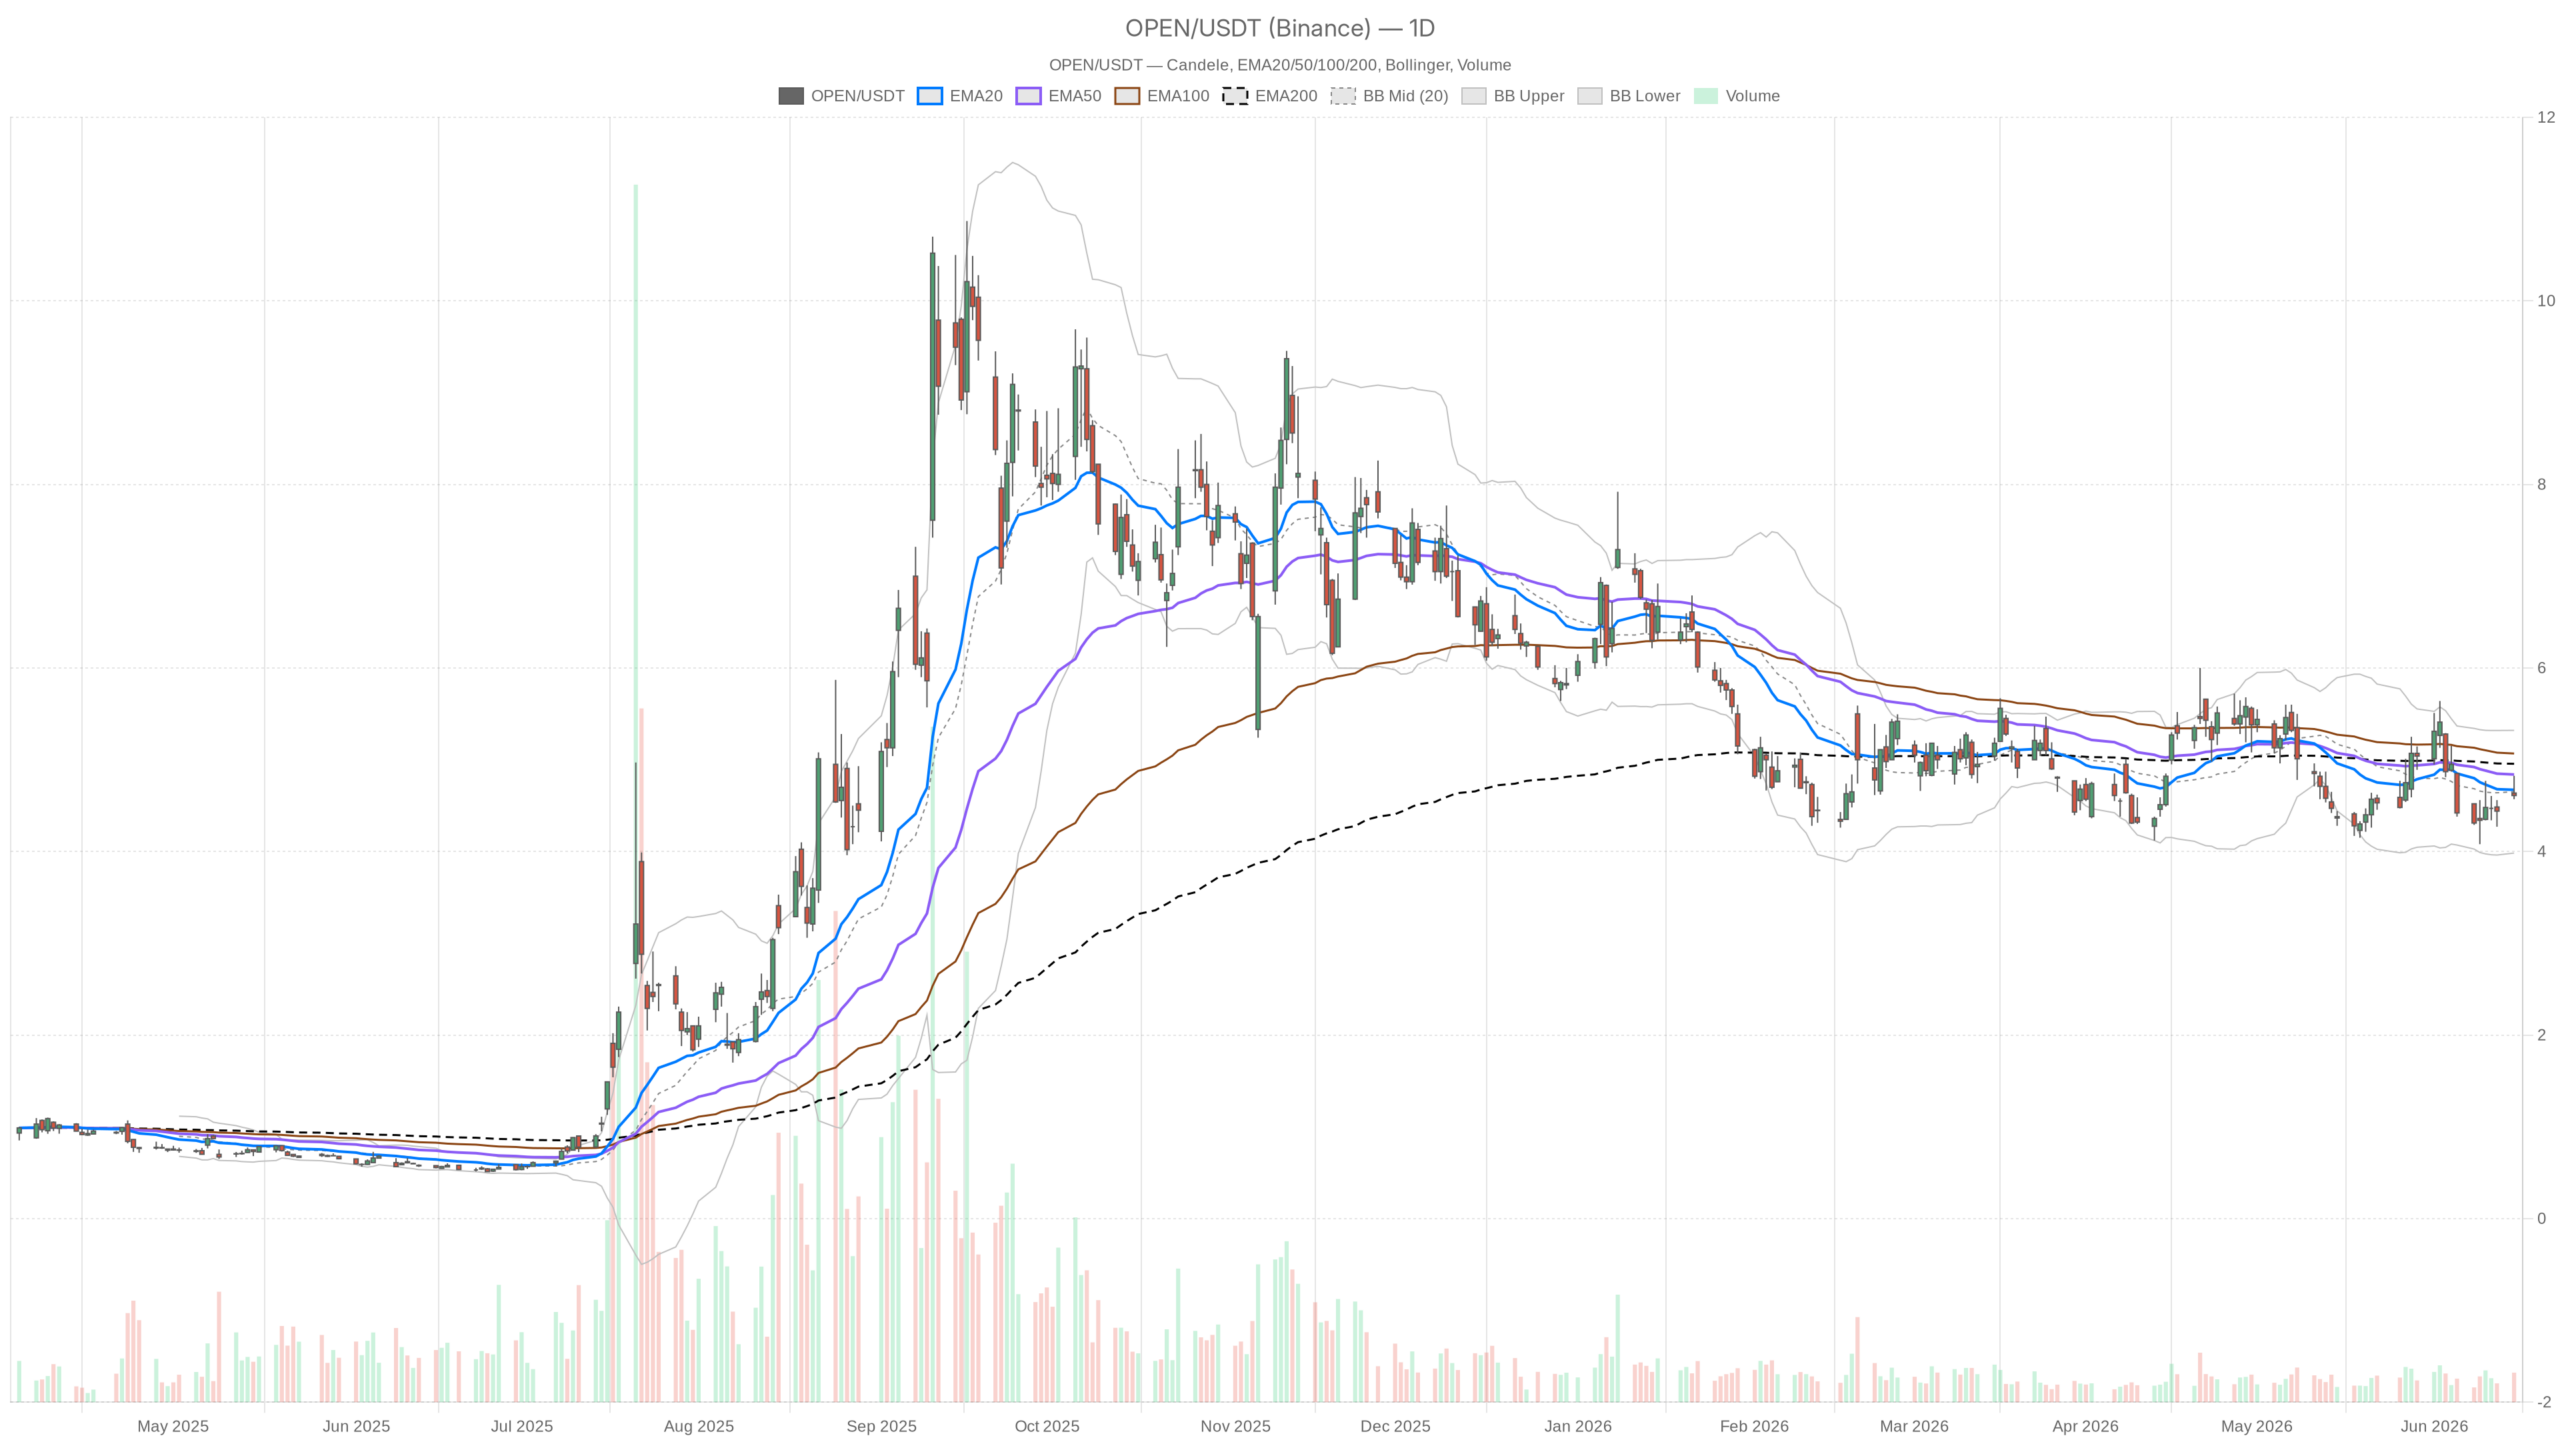 OPEN — daily chart with candles, EMA20/EMA50 and volumes.
Key points
- OPEN closed at $4.61, below the EMA20 at 4.67, EMA50 at 4.84 and EMA200 at 4.96
- The daily RSI at 47.32 remains below the neutral threshold of 50, with no oversold signals
- On the hourly timeframe the price has moved back above the EMA20 and EMA50: this is the key divergence to monitor
- Compression on the 15‑minute chart anticipates an imminent directional move
- Operational levels to follow: $4.67 to the upside, $4.51 to the downside
The daily confirms a bearish structure
The daily picture remains unambiguously bearish. OPEN at $4.61 is trading below all three main exponential moving averages: EMA20 at 4.67, EMA50 at 4.84 and EMA200 at 4.96. This is not a random proximity: the stock has been below the 200‑day average for some time and the downward arrangement of the three EMAs reflects a progressive loss of strength.
Every bounce has struggled to regain ground in a lasting way. The 15 June session is an example: OPEN hit a high of $4.83 but closed at $4.61, leaving a significant upper shadow. The RSI at 47.32 is not oversold but is below the neutral threshold of 50, indicating that selling pressure has not yet been exhausted. There is no capitulation, but neither is there demand organizing itself convincingly.
MACD and Bollinger: no reversal in sight
Momentum indicators confirm the bearish reading without offering signs of an imminent turning point. The daily MACD remains in negative territory: line at -0.11, signal at -0.09 and histogram at -0.02. The divergence has slightly worsened relative to the signal. This is not a collapse, but the MACD has not yet built the foundations for a credible reversal.
The Bollinger Bands outline a wide range: upper band at 5.32, lower band at 3.98, with the median at 4.65. The price is just below the median: there is no imminent compression, but neither is there directional expansion. The ATR at $0.43 defines the actual trading volatility, a significant potential swing that calls for caution in intraday trading.
The daily pivot levels place the point of control at 4.67, resistance R1 at 4.77 and support S1 at $4.51. OPEN closed below the pivot point, a detail that traders rarely ignore as an operational reference.
The hourly timeframe shows a timid recovery
In the short term, the pressure eases. On the one‑hour chart, OPEN has moved back above the EMA20 at 4.55 and the EMA50 at 4.58, creating a divergence with the daily that represents the main tension to monitor today. On the daily chart the stock is below the averages, on the hourly it has moved back above them.
The hourly MACD is slightly positive: line at 0.04, signal at 0.02 and histogram at 0.02. It is not a strong signal, but the bullish crossover is holding. The RSI at 54.12 confirms that short‑term momentum is recovering ground without excesses. The price is moving within the hourly Bollinger Bands — upper band at 4.74, lower at 4.29 — with the hourly pivot practically aligned with the close. In the short term the market is breathing, but has not yet chosen a direction.
The 15‑minute chart traps OPEN in a compression
The 15‑minute chart signals a phase of indecision that tends to precede a directional move. The MACD is flat — line at 0.01, signal at 0.02 and a slightly negative histogram at -0.01 — while the RSI at 49.8 is almost exactly in the middle of the scale.
The Bollinger Bands are tightening around the median at 4.65, with a range of only 21 cents between upper and lower. The pivot levels are extremely tight: R1 at 4.62, S1 at 4.59 and PP at 4.61. The price is literally stuck in this corridor. For those trading OPEN intraday, the 4.59–4.62 area is the neutral zone from which to wait for a breakout, in one direction or the other.
Bullish scenario: the levels OPEN must break
For a credible reversal, OPEN must first reclaim the daily pivot at $4.67. This is not a huge distance from the current close, but what matters is the quality of the recovery, not just the simple crossing of the threshold. A convincing daily close above 4.67 would put the stock back above the point of control and reduce pressure on short sellers.
The next level is R1 at 4.77, an area where OPEN has already encountered resistance during the session. A breakout supported by a daily MACD that starts to reduce the negative histogram and by an RSI above 50 would lay the groundwork for an attempt toward the EMA50 at 4.84. In that context, positive news — from Eric Jackson’s bullish thesis to the reduction in mortgage rates linked to the Iran deal — could amplify the technical move.
A truly structurally bullish scenario, however, would require a break of the EMA200 at $4.96: only above that level would the picture change in a lasting way.
Bearish scenario: thresholds that must hold
The key support that must not be lost is daily S1 at $4.51. Below that level, the bearish structure would be confirmed and pressure toward the lower Bollinger Band at 3.98 would become more concrete. This would not be an immediate crash, but the kind of breakdown that tends to attract new selling.
In the short term, the first warning sign would be the loss of hourly support at 4.58 with significant volume. The hourly MACD, which for now is holding the positive signal, would turn negative in a few candles if the price were to drop decisively. The rebound thesis built on the one‑hour timeframe would be quickly dismantled, bringing OPEN back in line with the bearish daily regime.
Context and catalysts: uncertainty remains high
OPEN is moving in an ambiguous transition framework. The daily is bearish, but the hourly is attempting a recovery while the fundamental backdrop is heating up with new elements. Traders are watching closely the $4.67–$4.77 area to the upside and support at 4.51 to the downside.
On the fundamental side, the “Tesla of real estate” thesis put forward by Eric Jackson is explosive in tone but requires a very long horizon to materialize. The reduction in mortgage rates linked to the peace agreement with Iran is instead a more immediate catalyst. Opendoor, as an iBuyer platform exposed to mortgages and housing‑market liquidity, could benefit directly.
The market, however, has not yet priced in anything definitive. The Opendoor price remains stuck at $4.61, volumes are not explosive and the technical structure demands confirmation before betting on a clear directionality. The next levels to break — 4.67 first, then 4.77 — are the litmus test of real interest in this stock.
FAQ
Is OPEN in an uptrend or downtrend?
OPEN’s daily trend remains bearish. The price at $4.61 is below the EMA20, EMA50 and EMA200, with all three averages in a downward arrangement. Only a close above $4.96 (EMA200) would change the structural scenario.
What are the key levels to monitor?
To the upside, the first obstacle is the daily pivot at $4.67, followed by R1 at 4.77 and the EMA50 at 4.84. To the downside, the critical support is S1 at $4.51: a break would open the way toward the lower Bollinger Band at 3.98.
What does the compression on the 15‑minute chart indicate?
The compression of the Bollinger Bands on the 15‑minute chart, with a range of only 21 cents, indicates a phase of indecision that typically precedes a directional move. The price is stuck between $4.59 and $4.62, awaiting a breakout.
Which fundamental catalysts could move OPEN?
Two recent factors: the “Tesla of real estate” thesis put forward by Eric Jackson and the reduction in mortgage rates linked to the peace agreement with Iran. The latter is a more immediate catalyst for the real estate sector and for Opendoor as an iBuyer platform.
{“@context”:”https://schema.org”,”@type”:”FAQPage”,”mainEntity”:[{“@type”:”Question”,”name”:”Is OPEN in an uptrend or downtrend?”,”acceptedAnswer”:{“@type”:”Answer”,”text”:”OPEN’s daily trend remains bearish. The price at $4.61 is below the EMA20, EMA50 and EMA200, with all three averages in a downward arrangement. Only a close above $4.96 (EMA200) would change the structural scenario.”}},{“@type”:”Question”,”name”:”What are the key levels to monitor?”,”acceptedAnswer”:{“@type”:”Answer”,”text”:”To the upside, the first obstacle is the daily pivot at $4.67, followed by R1 at 4.77 and the EMA50 at 4.84. To the downside, the critical support is S1 at $4.51: a break would open the way toward the lower Bollinger Band at 3.98.”}},{“@type”:”Question”,”name”:”What does the compression on the 15-minute chart indicate?”,”acceptedAnswer”:{“@type”:”Answer”,”text”:”The compression of the Bollinger Bands on the 15-minute chart, with a range of only 21 cents, indicates a phase of indecision that typically precedes a directional move. The price is stuck between $4.59 and $4.62, awaiting a breakout.”}},{“@type”:”Question”,”name”:”Which fundamental catalysts could move OPEN?”,”acceptedAnswer”:{“@type”:”Answer”,”text”:”Two recent factors: the “Tesla of real estate” thesis put forward by Eric Jackson and the reduction in mortgage rates linked to the peace agreement with Iran. The latter is a more immediate catalyst for the real estate sector and for Opendoor as an iBuyer platform.”}}]}
Disclaimer: This article is for informational purposes only and does not constitute financial advice, investment recommendation or a solicitation to buy or sell financial instruments or cryptocurrencies. The analyses do not guarantee future results. Investments in crypto-assets and financial markets involve a high risk of loss of capital. Always do your own research (DYOR) and consult a qualified financial advisor before making any decision.
Content created with the assistance of artificial intelligence and with human editorial review.


You May Also Like

Adoption Leads Traders to Snorter Token

Exclusive interview with Smokey The Bera, co-founder of Berachain: How the innovative PoL public chain solves the liquidity problem and may be launched in a few months

Iran’s foreign minister targeted in assassination attempt, wife killed


