

Bitcoin (BTC) Tests a Critical Zone: Will Buyers Target $64K or Lose Ground to $60K?
- Bitcoin price is holding near $63.2K.
- BTC is testing the $64K resistance.
The largest asset, Bitcoin (BTC), is knocking on the door of the $64K resistance level again, but it’s stuck in a waiting game. Because the price is sitting right below its 50-day moving average, $65.8K, the market is essentially moving sideways.
The real trigger is tomorrow’s FOMC minutes. Traders are glued to this economic update, as any hints on interest rates could easily make waves in the market and break Bitcoin out of this tight box.
If buyers can push through and close a daily candle above $64K, it proves they have the strength to fight back toward that $65.8K line. On the flip side, if the news turns sour and sellers take control, the $60.7K level is the line in the sand. Losing that support could trigger a wider market sell-off, while holding it keeps the current recovery alive.
Significantly, BTC is currently trading at the $63,200 mark. With the brief bullish sentiment, the key resistance would be at around $63,361. A stronger push above $63.5K might invite the potent bulls to take charge, breaking it to higher targets. On the other hand, Bitcoin’s fall could aim for the support at $63,122. More downside wakes the potent bears to trigger the price retrace below $62.9K. If this range holds, further losses can be avoided.
What is Bitcoin’s Technical Setup Conveying?
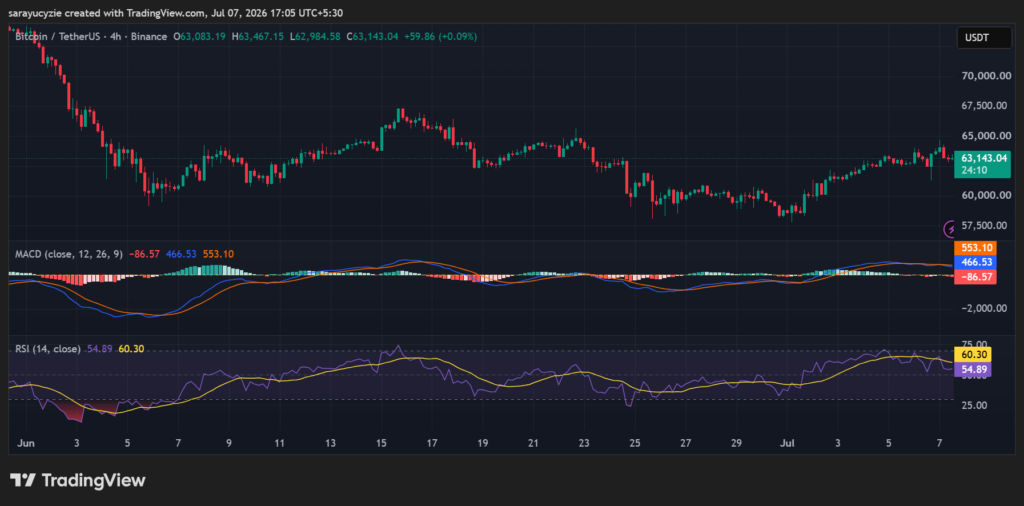
The four-hour trading chart of Bitcoin shows that the Moving Average Convergence Divergence line and the signal line are above the zero line. It is in a long-term bullish trend. However, because the MACD line has crossed below the signal line, indicating that the short-term uptrend is slowing down.
The market is currently experiencing a temporary pullback or consolidation. Traders often view this as a potential time to lock in profits or wait for a stabilization before buying back in.
 (Source: TradingView)
Furthermore, the daily Relative Strength Index (RSI) is resting at 54.89, placing BTC in a neutral-to-slightly bullish territory. It is sitting comfortably away from being overbought or oversold. As it is above the 50 mark, the buyers are currently having an edge, but neither the bulls nor the bears are in full control.
Also, the market is either consolidating, moving sideways, or quietly catching its breath before making its next major move.
Crypto Market Highlights
MUBARAK Defies the Norm: 116% Volume Surge Sparks a Major Shift on the Charts


You May Also Like

Unleashing A New Era Of Seller Empowerment

PHL new upper-middle-income status should spur human capital investments – CPD, UNFPA

StakeStone (STO) Rockets 125%: What $981M Trading Volume Reveals



