

Nvidia Stock Slides 13% but 44 Analyst Upgrades Build Bull Case
Nvidia stock trades near $194.83, sitting below key short- and medium-term moving averages. Momentum indicators remain in negative territory. The daily regime reads neutral, but the structure is cautious. The stock has pulled back roughly 13% over the past month with no confirmed floor yet.
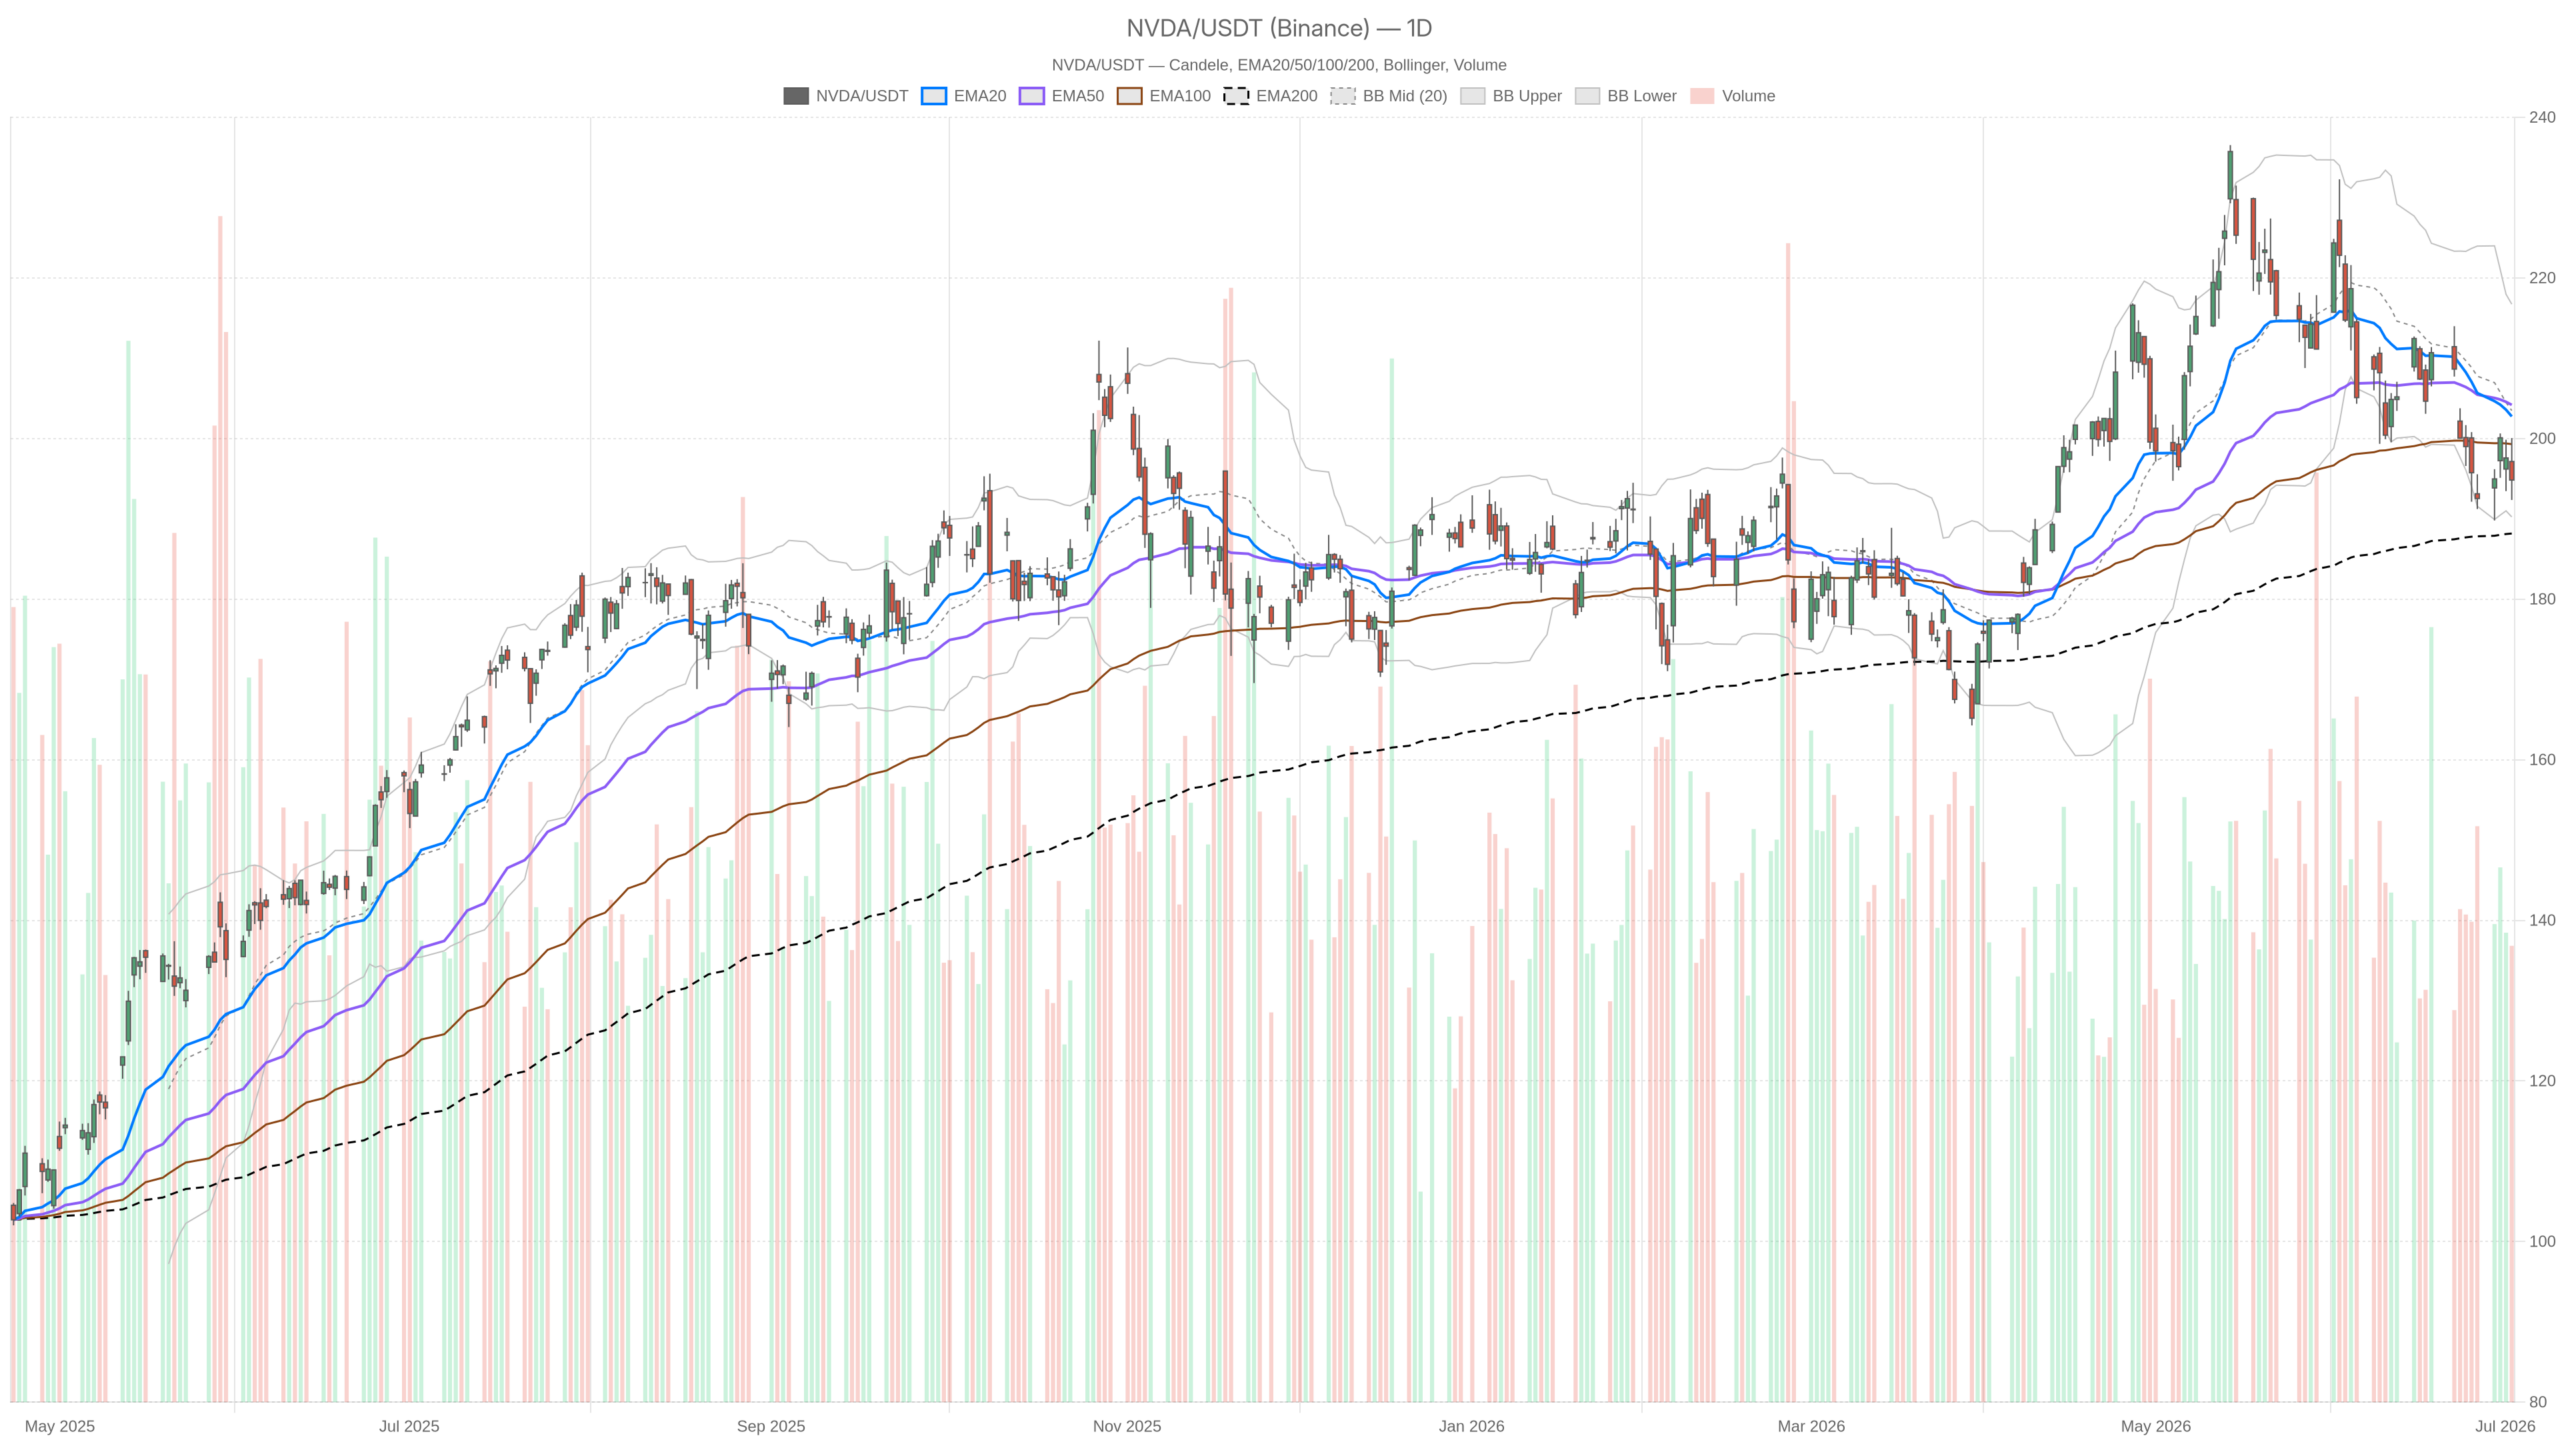 NVDA — daily chart with candlesticks, EMA20/EMA50 and volume.
Key takeaways
- NVDA trades below its EMA20 ($202.75) and EMA50 ($204.19), with overhead resistance stacking up across multiple timeframes.
- Daily RSI at 41.16 and a widening MACD histogram confirm bearish momentum has not reversed.
- A break below S1 at $191.43 opens the path to the EMA200 at $188.17, the last structural anchor for the uptrend.
- The bullish case requires reclaiming the $195.75 daily pivot followed by a close above the $199–$200 resistance zone.
- Fundamental tailwinds persist: 44 upward EPS revisions versus only 4 downward, plus sustained AI infrastructure demand.
What Is the Current Technical Picture for Nvidia Stock?
Nvidia stock is in a corrective phase, trading below its short-term moving averages with bearish momentum still intact. Price sits beneath the daily pivot and shows no confirmed reversal signal.
Daily Chart Shows Resistance and Weak Momentum
Nvidia stock closed at $194.83, well below the EMA20 at $202.75 and the EMA50 at $204.19. These two averages are converging above current price. They now form a clear overhead resistance zone. The EMA200 at $188.17 remains below the market. This is one of the few structurally bullish anchors still intact on the daily timeframe. A test of that level is possible if selling pressure intensifies.
The daily RSI at 41.16 is approaching oversold territory without quite reaching it. Momentum tends to slow in this zone. However, that does not signal a reversal on its own. The daily MACD confirms the bearish lean. The MACD line sits at -4.09, below the signal line at -3.09. The histogram reads -1.00. This negative reading means bearish divergence between the two lines is still widening. There is no inflection yet.
Bollinger Bands place price near the lower portion of the range. The lower band sits at $190.24. The midline is at $203.48. NVDA trades significantly below that midline. This is consistent with a stock in a corrective phase, not a trending advance. The upper band at $216.73 remains distant and irrelevant to the near-term picture. Daily ATR of $6.34 reflects meaningful intraday swings. Risk management must remain a priority for any positioning around Nvidia stock.
Daily pivot structure adds further context. The pivot point sits at $195.75, just above the last close. R1 resistance is at $199.14. S1 support stands at $191.43. NVDA closed marginally below its own pivot. This is a subtle but real sign of near-term weakness. A sustained move back above $195.75 would be the first clean technical signal of shifting sentiment.
Hourly and 15-Minute Charts Add Nuance
On the hourly chart, the picture weakens further. The H1 regime is explicitly bearish. Price trades below the EMA20 at $195.79, the EMA50 at $197.52, and the EMA200 at $204.58. That EMA200 alignment on the hourly frame reflects a broader deterioration in trend structure. The hourly MACD line at -0.81 remains below the signal at -0.39. The histogram of -0.42 confirms the intraday trend still points lower. Hourly RSI at 44.60 is subdued but not extreme. There is still room to the downside before a bounce becomes technically overdue.
However, the 15-minute chart introduces a minor nuance. The shortest timeframe shows a MACD histogram turning slightly positive at +0.20. The RSI has recovered to 50.55, essentially neutral. Price on the 15-minute frame closed above its EMA20 at $194.15. This suggests a short-term stabilization attempt near the $194–$195 zone. It does not override the bearish H1 context. It does suggest immediate selling pressure may be easing intraday. The 15-minute ATR at $0.95 shows contained near-term volatility.
There is a clear conflict between the 15-minute stabilization and the hourly bearish regime. The 15-minute signal should be treated as a potential short-term bounce within a larger corrective structure. It is not a trend reversal. The daily and hourly frames carry far more weight for directional conclusions on Nvidia stock.
What Do the Key Indicators Say About Nvidia Stock?
The key indicators for Nvidia stock point to a persistent bearish bias, with no confirmed reversal signal across any meaningful timeframe. Price remains trapped below dynamic resistance while momentum continues to deteriorate.
The daily MACD histogram remains negative and is still widening. This means bearish momentum is expanding, not contracting. The RSI at 41.16 sits in a no-man’s-land. It is weak enough to confirm the downtrend. Yet it is not oversold enough to trigger a reflexive bounce. Meanwhile, the price is trapped below the EMA20 and EMA50. These averages now function as dynamic resistance for Nvidia stock.
On the other hand, the EMA200 at $188.17 remains below price. This is the single technical element keeping the broader structure from turning fully bearish. A test of that level would be a critical moment for the trend. Holding above it preserves the long-term uptrend. Breaking below it would signal a deeper structural shift.
What Are the Bullish and Bearish Scenarios for Nvidia Stock?
Nvidia stock faces two competing scenarios: a bullish case built on valuation and demand resilience, and a bearish case driven by unresolved technical weakness. The next few sessions will likely determine which path dominates.
Bullish Scenario Depends on Reclaiming Key Levels
The bullish scenario rests on a combination of valuation reset and demand resilience. NVDA now trades at a discount to Coca-Cola on certain valuation metrics. The stock is increasingly discussed as attractively priced relative to its earnings trajectory. A reclaim of the $195.75 daily pivot would be the first step. A close above the $199–$200 resistance zone would follow. That would shift the near-term technical picture meaningfully. A move through the EMA20 at $202.75 would further confirm the corrective phase is exhausting itself. The EMA200 at $188.17 provides a deeper support anchor if bulls need a second chance.
Bearish Scenario Hinges on Support Breakdown
In contrast, the bearish scenario plays out if NVDA fails to hold the $191–$192 zone. A break below daily S1 at $191.43 would open the path lower. A subsequent test of the EMA200 at $188.17 would suggest the correction has more room to run. Sustained trading below the daily pivot with a widening MACD histogram would invalidate any near-term recovery thesis. In that context, fundamental optimism would need to wait for price structure to stabilize before becoming actionable.
Is the Fundamental Backdrop Shifting for Nvidia Stock?
Yes, the fundamental backdrop for Nvidia stock is quietly strengthening, even as the technical picture remains cautious. AI demand signals and earnings revisions tell a more constructive story than the charts currently reflect.
On the fundamental side, the news flow offers a more constructive backdrop. NVDA’s Blackwell B300 chips are reportedly the subject of a supply agreement with Bit Origin, an AI computing infrastructure company. The deal is worth approximately $11 million. Beyond that transaction, reports of black market demand for Nvidia chips in China have surfaced. This is an unorthodox signal of genuine supply constraint. The company also announced a strategic investment in Verkada. This move accelerates physical AI adoption in real-world environments.
Separately, analyst EPS revisions remain skewed sharply positive. There have been 44 upward revisions versus only 4 downward for the upcoming fiscal year. These are not trivial data points. They reflect deep conviction among analysts that demand remains robust. At the same time, the valuation conversation around Nvidia stock is shifting. NVDA is increasingly seen as attractively priced relative to its growth trajectory.
Where Does Nvidia Stock Go From Here?
Nvidia stock sits at a technically vulnerable but fundamentally debated junction, demanding patience from both bulls and bears. The correction has not yet run its course on the charts, but the valuation argument is quietly building.
Overall, Nvidia stock remains in a correction. The daily and hourly frames both favor caution. Momentum has not turned. Trend resistance is stacked overhead. The stock continues to trade below its pivot and short-term averages. Still, the valuation conversation is shifting. AI demand signals remain intact. The 15-minute frame hints at near-term stabilization.
Positioning here demands patience. The price structure needs to confirm what the fundamentals are beginning to suggest. Acting ahead of the technical evidence carries elevated risk. Waiting for a reclaim of the $195.75 pivot or a clean hold of $191.43 support provides clearer entry signals. In either direction, Nvidia stock will reveal its hand soon enough.
FAQ
Is Nvidia stock in a bear market?
Nvidia stock is in a corrective phase, not a confirmed bear market. The daily regime is classified as neutral, and the EMA200 at $188.17 remains below price, keeping the long-term structure intact. A break below $188.17 would shift the regime more decisively bearish.
What is the key support level for Nvidia stock?
The immediate support is the daily S1 at $191.43. Below that, the EMA200 at $188.17 serves as the critical structural anchor. Holding above these levels preserves the broader uptrend for Nvidia stock.
What would turn Nvidia stock bullish again?
A reclaim of the daily pivot at $195.75, followed by a close above the $199–$200 resistance zone, would shift the near-term picture. A move through the EMA20 at $202.75 would further confirm the correction is exhausting itself.
Are fundamentals supporting Nvidia stock right now?
Yes. Analyst EPS revisions show 44 upward adjustments versus only 4 downward for the upcoming fiscal year. Additionally, AI infrastructure demand remains robust, with new supply agreements and strategic investments reinforcing the long-term growth narrative.
Disclaimer: This article is for informational purposes only and does not constitute financial advice, an investment recommendation, or a solicitation to buy or sell any financial instrument or cryptocurrency. The analysis provided is not indicative of future results. Investing in crypto assets and financial markets carries a high risk of capital loss. Always do your own research (DYOR) and consult a qualified financial advisor before making any decision.
Article produced with the assistance of artificial intelligence and reviewed by the editorial team.


You May Also Like

Dave Portnoy Vows To Ride Bitcoin To Zero After Buying At $100K
Intel (INTC) Stock Climbs to $120.35 as Institutional Buying Accelerates
Futures Rise As Tech Rebounds In Post-Holiday Catch Up



