

Solana (SOL) Price Rallies 23% From June Bottom — Will $80 Resistance Hold Strong?
Quick Summary
- Approximately 600,000 SOL tokens recently moved to centralized exchanges, signaling potential selling pressure or hedging activity.
- Technical analyst Ali Charts identified a TD Sequential sell signal on the 4-hour timeframe, with immediate resistance at $74.65 and the 200 SMA positioned at $75.
- SOL currently hovers near $74, marking a substantial 23% climb from its June bottom at $60.
- The $73 price point remains crucial — maintaining levels above this threshold supports the ongoing recovery narrative.
- Market observers are focused on the $80–$82 resistance band, while $50 represents significant downside support if bearish momentum returns.
Solana (SOL) has recovered to approximately $74 following a significant 23% rebound from its June nadir of $60. This upward movement comes after a pronounced downturn earlier in the month that sent prices tumbling beneath a critical support threshold that had remained intact for several months.
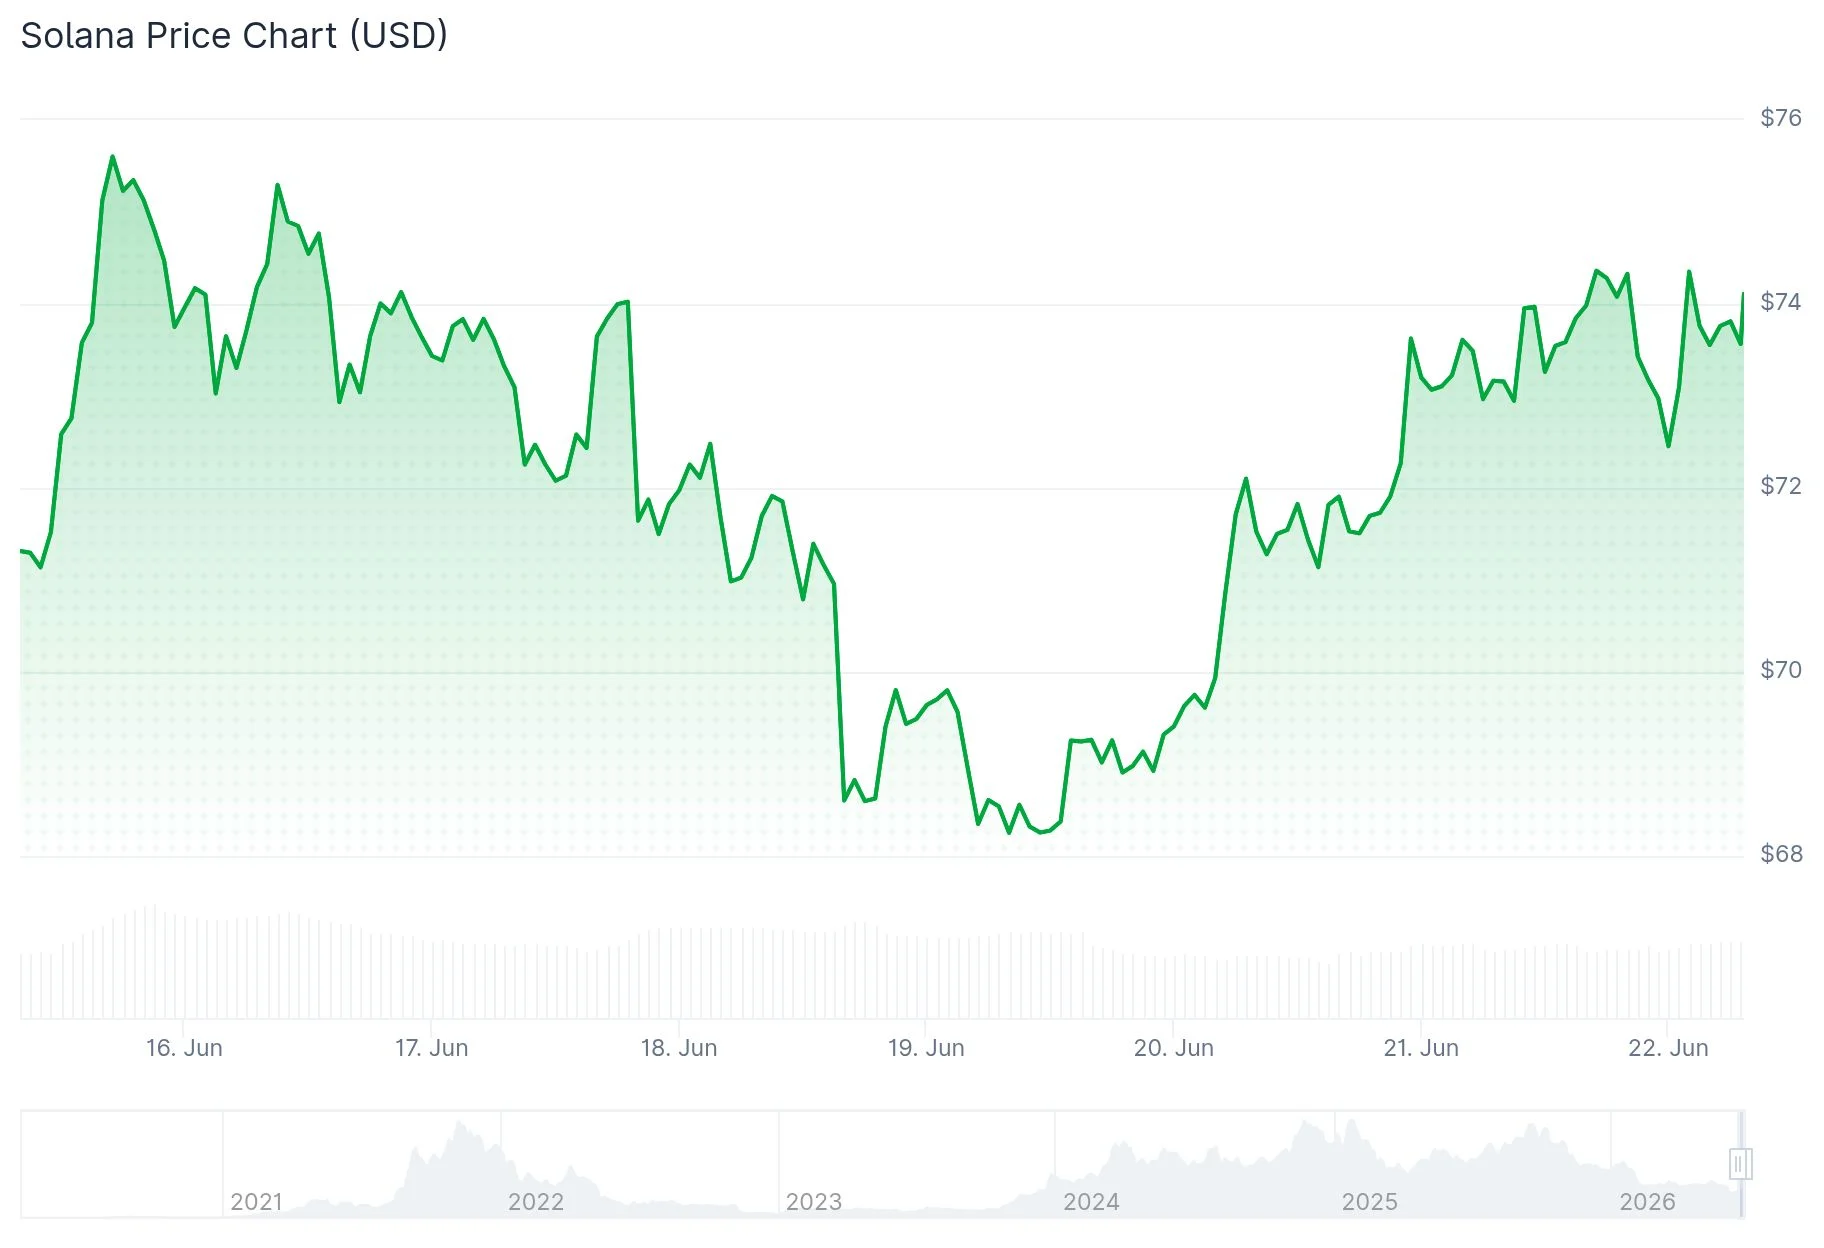 Solana (SOL) Price
The cryptocurrency currently registers $1.89 billion in 24-hour trading volume, supporting a market capitalization of $42.96 billion. Over the past day, SOL has posted a 3.08% increase.
Cryptocurrency analyst Ali Charts shared observations on X, indicating that after a TD Sequential buy signal emerged last Friday, SOL climbed 8.40% from $68.46 to reach a peak of $74.27. However, Ali Charts has now identified a fresh sell signal appearing on the 4-hour chart, with price action encountering resistance at $74.65. This resistance point coincides with the 4-hour 200 simple moving average at $75, creating what Ali Charts characterizes as a “highly concentrated technical ceiling.” Should price pull back from this level, $71 could serve as the initial target, with a deeper retracement potentially reaching $68.46.
[[LINK_START_0]]https://twitter.com/alicharts/status/2068815473446121865?s=20[[LINK_END_0]]In a separate observation, Ali Charts’ blockchain data reveals that roughly 600,000 SOL tokens have recently transferred into centralized exchanges. Substantial inflow surges of this magnitude typically indicate that holders may be positioning to liquidate or establish hedge positions, potentially creating near-term downward pressure.
Critical Price Levels Under Scrutiny
Throughout the February-to-May period, the $73 level functioned as Solana’s primary support foundation. When price action breached this level downward in June, it transformed into resistance. A confirmed daily close above $74 would indicate the June decline was merely a bear trap. Conversely, inability to maintain current levels could result in price retreating toward $60.
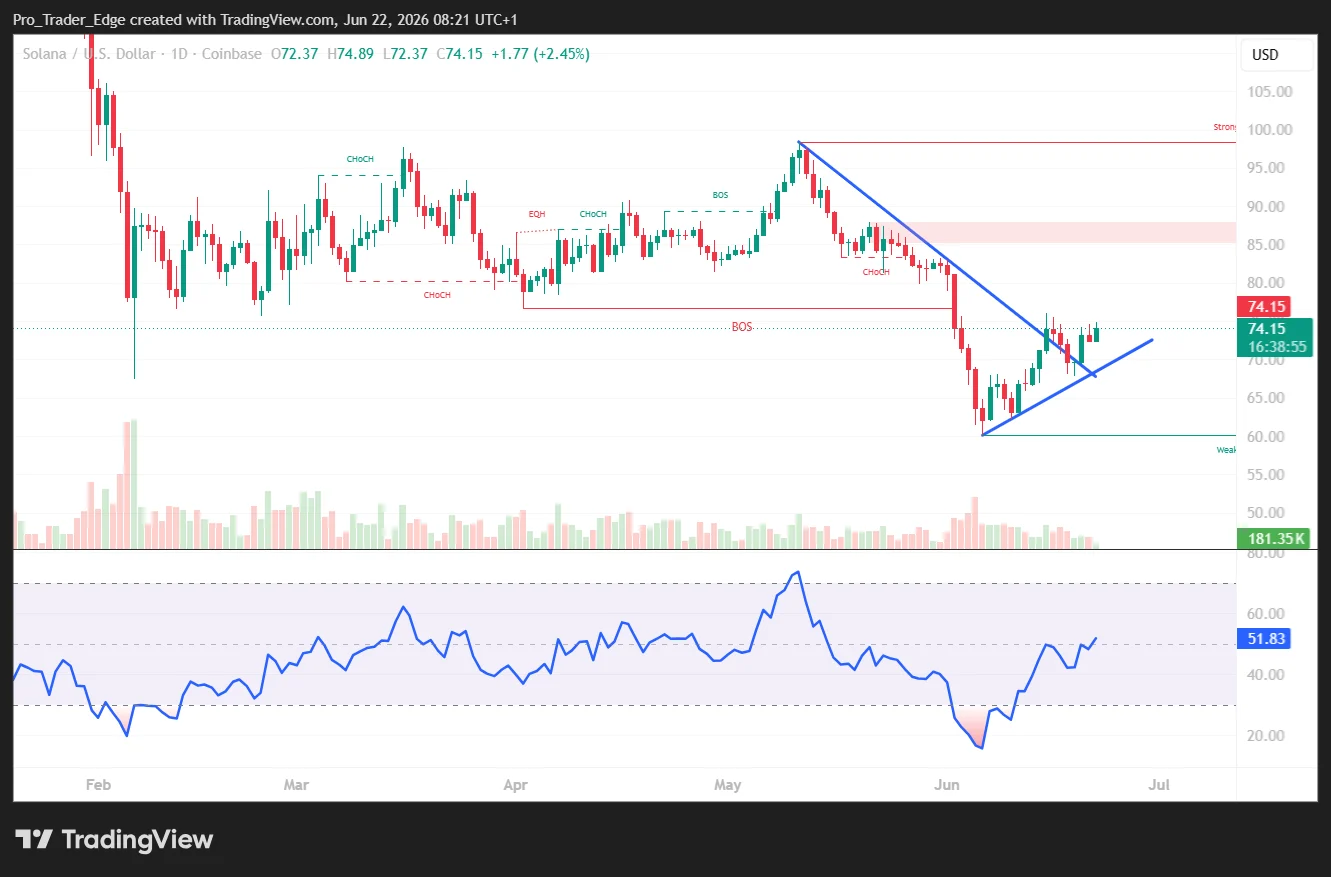 Source: TradingView
The Relative Strength Index plummeted to approximately 21 during June’s selloff, indicating deeply oversold conditions. The indicator has since rebounded to 48.45, with its signal line positioned at 39.77. Technical analysts suggest this configuration may precede a more decisive directional movement.
Analyst BitGuru emphasized that SOL rebounded from a significant reversal area where selling pressure had previously dominated. Buyers have subsequently entered and stabilized price movement, which BitGuru interprets as accumulation patterns rather than the onset of an extended bearish trend.
Analyst Altcoin Sherpa has recommended prudence, stating SOL appears “trash on high time frames” until it demonstrates a structural transformation. He awaits a definitive reclaim of $77 before considering long position entries.
Overhead Resistance and Downside Support Zones
The 50-day simple moving average currently rests at $79.85, a metric that has tracked Solana’s directional bias since February. Breaking above this threshold would bring $90 into reasonable reach.
Analyst EliZ is tracking the $82–$90 weekly supply zone, characterizing it as transitioning from resistance to potential support. He maintains a constructive view on Solana’s ecosystem while awaiting broader market confirmation.
Should the current recovery falter and price decline below $73, the subsequent area of interest sits within the $67–$68 range. A confirmed daily close beneath $60 would completely negate the bullish recovery scenario, with $50 identified as substantial support at deeper levels.
SOL is presently challenging resistance near $74.65, with the 4-hour sell signal and elevated exchange inflows suggesting potential near-term consolidation before the next significant directional shift.
The post Solana (SOL) Price Rallies 23% From June Bottom — Will $80 Resistance Hold Strong? appeared first on Blockonomi.


You May Also Like

ApeMars Price Prediction: Will APRZ Get a CEX Listing Soon

Infamous MEV Bot JaredFromSubway Drained For $7.5 Million

Exclusive: Index Ventures, Union Square Ventures back trading app Fomo at $550 million valuation


