

Solana (SOL) Price: Bounced 23% From June Lows — But Can It Break the $80 Wall?
TLDR
- Around 600,000 SOL tokens have flowed into centralized exchanges, a sign traders may be preparing to sell or hedge.
- Analyst Ali Charts flagged a TD Sequential sell signal on the 4-hour chart, with resistance at $74.65 and the 200 SMA at $75.
- SOL is currently trading around $74, up roughly 23% from its June low of $60.
- The $73 level is a key line — holding above it keeps the recovery thesis intact.
- Analysts are watching $80–$82 as the next resistance zone, with $50 cited as deep support below.
Solana (SOL) is trading at around $74 after bouncing nearly 23% from its June low of $60. The recovery follows a sharp sell-off earlier this month that pushed the price well below a key support zone that had held for months.
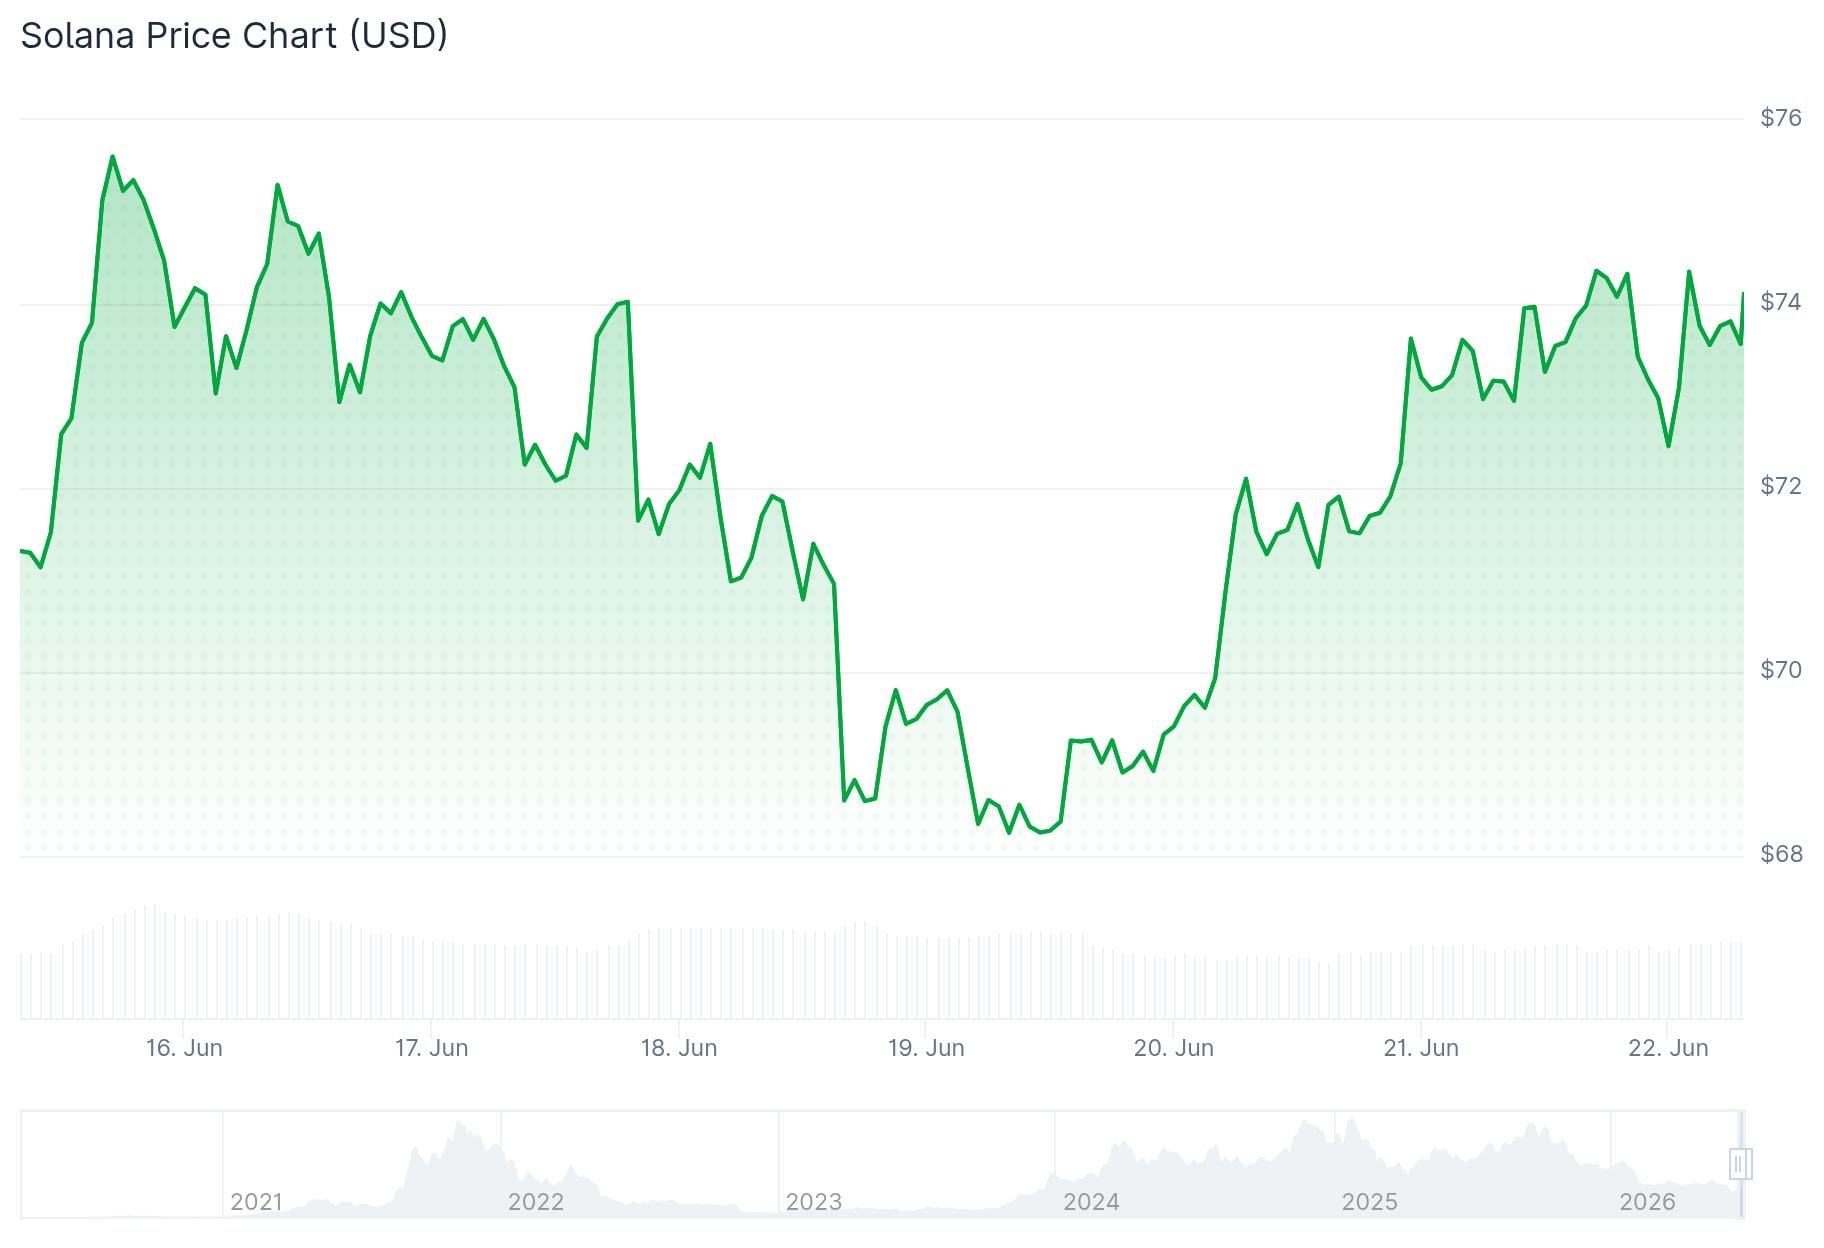 Solana (SOL) Price
SOL’s 24-hour trading volume sits at $1.89 billion, with a market cap of $42.96 billion. The token posted a 3.08% gain in the last 24 hours.
Crypto analyst Ali Charts noted on X that following a TD Sequential buy signal last Friday, SOL climbed 8.40% from $68.46 to a high of $74.27. However, Ali Charts also flagged that a sell signal has now appeared on the 4-hour chart, with price testing resistance at $74.65. That level aligns with the 4-hour 200 SMA at $75, forming what Ali Charts described as a “highly concentrated technical ceiling.” A pullback from here could target $71, with an extended move back to $68.46.
Separately, around 600,000 SOL tokens have recently moved into centralized exchanges, according to Ali Charts’ on-chain data. Large inflow spikes like this often suggest holders are preparing to sell or hedge, which can create short-term price pressure.
Key Levels Traders Are Watching
From February through May, $73 acted as Solana’s main support level. When the price dropped below that in June, it flipped to resistance. A daily close back above $74 would suggest the June drop was a bear trap. Failure to hold could send the price back toward $60.
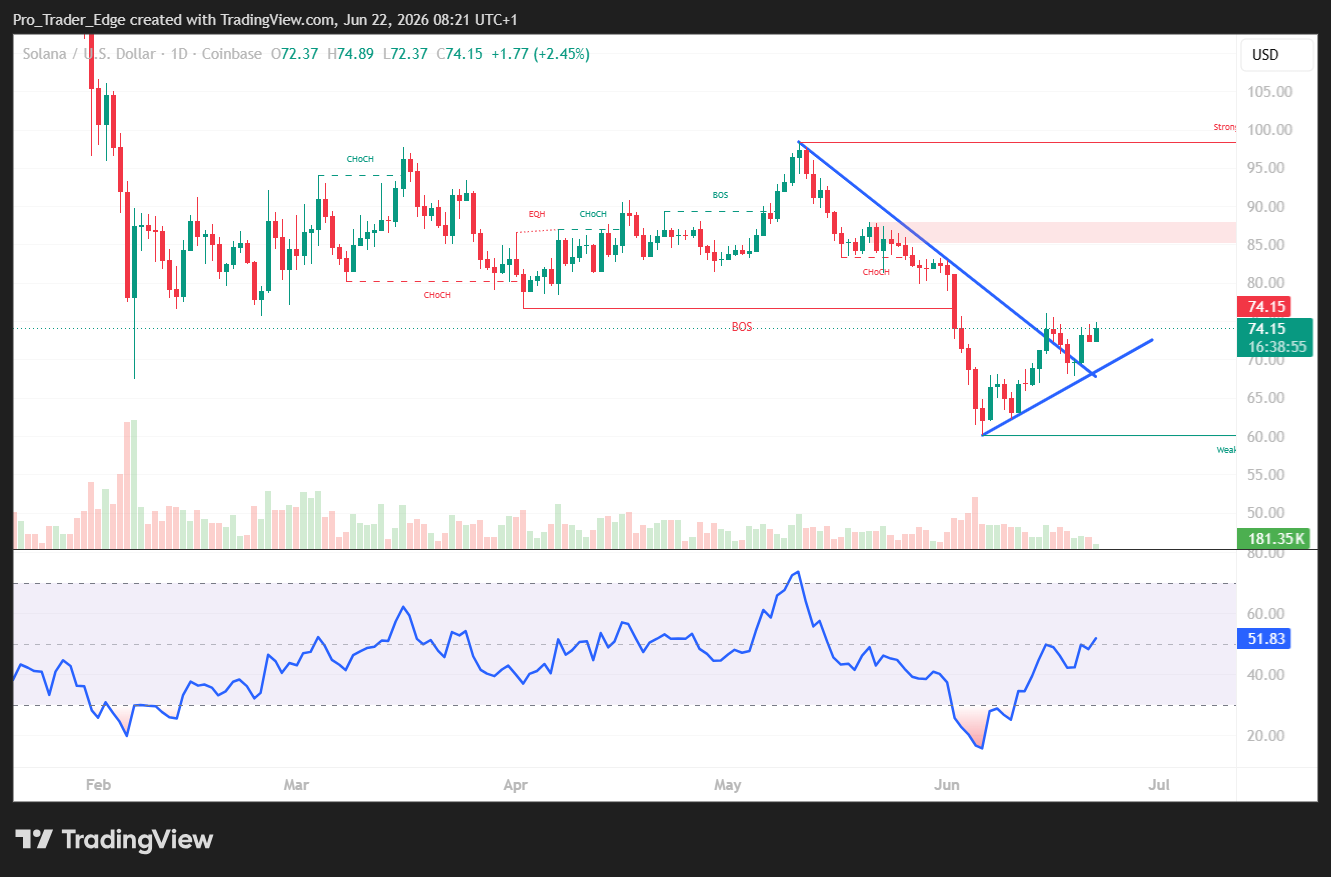 Source: TradingView
The RSI dropped to around 21 during the June sell-off, a deeply oversold reading. It has since recovered to 48.45, with its signal line at 39.77. Analysts note this setup could precede a sharper move in either direction.
Analyst BitGuru highlighted that SOL bounced from an important reversal zone where sellers previously dominated. Buyers have since stepped in and stabilized price action, which BitGuru views as consistent with accumulation behavior rather than the start of a longer bear trend.
Analyst Altcoin Sherpa has urged caution, saying SOL remains “trash on high time frames” until it can confirm a structural shift. He is waiting for a clear reclaim of $77 before considering long entries.
Resistance Above and Support Below
The 50-day simple moving average sits at $79.85, a level that has tracked Solana’s trend since February. Getting above this would put $90 in play.
Analyst EliZ is monitoring the $82–$90 weekly supply zone, describing it as flipping from resistance to support. He remains bullish on Solana’s ecosystem but is waiting for broader market momentum to confirm.
If the current recovery fails and price slides below $73, the next area of interest is the $67–$68 range. A daily close below $60 would invalidate the bullish recovery thesis entirely, with $50 cited as a major support level further down.
SOL is currently testing resistance near $74.65, with the 4-hour sell signal and exchange inflows pointing to possible short-term cooling before the next directional move.
The post Solana (SOL) Price: Bounced 23% From June Lows — But Can It Break the $80 Wall? appeared first on CoinCentral.


You May Also Like

ArtGis Finance Partners with MetaXR to Expand its DeFi Offerings in the Metaverse

Ethereum Stablecoin Supply Contracts: USDT Down 2.83%, USDC Down 2.72% Over 30 Days

Morgan Stanley Undercuts Rivals — Launches Ethereum and Solana ETFs


Trending News
More
